|
Download Data (XLS File) |
|
||||||||
|
||||||||
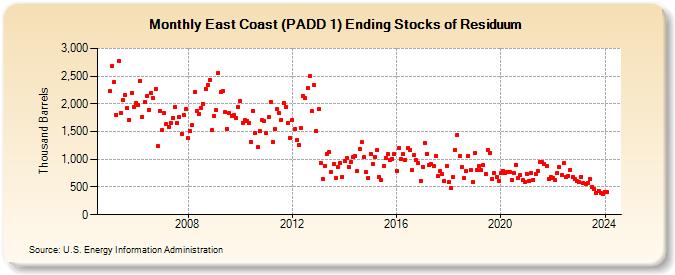
| East Coast (PADD 1) Ending Stocks of Residuum (Thousand Barrels) | ||||||||
| Year | Jan | Feb | Mar | Apr | May | Jun | Jul | Aug | Sep | Oct | Nov | Dec |
|---|---|---|---|---|---|---|---|---|---|---|---|---|
| 2005 | 2,223 | 2,687 | 2,399 | 1,805 | 2,764 | 1,840 | 2,061 | 2,157 | 1,925 | 1,709 | 2,202 | 1,939 |
| 2006 | 2,017 | 1,980 | 2,418 | 1,765 | 2,031 | 2,138 | 1,897 | 2,191 | 2,098 | 2,274 | 1,232 | 1,876 |
| 2007 | 1,522 | 1,836 | 1,639 | 1,589 | 1,660 | 1,744 | 1,938 | 1,650 | 1,754 | 1,462 | 1,805 | 1,902 |
| 2008 | 1,377 | 1,503 | 1,614 | 2,219 | 1,874 | 1,823 | 1,929 | 2,002 | 2,271 | 2,342 | 2,433 | 1,521 |
| 2009 | 1,774 | 1,888 | 2,558 | 2,214 | 2,223 | 1,852 | 1,551 | 1,826 | 1,779 | 1,791 | 1,751 | 1,943 |
| 2010 | 2,054 | 1,659 | 1,703 | 1,695 | 1,649 | 1,311 | 1,878 | 1,467 | 1,219 | 1,514 | 1,706 | 1,683 |
| 2011 | 1,465 | 1,763 | 2,034 | 1,315 | 1,549 | 1,899 | 1,829 | 1,713 | 2,013 | 1,950 | 1,651 | 1,392 |
| 2012 | 1,717 | 1,548 | 1,345 | 1,257 | 1,563 | 2,147 | 2,098 | 2,283 | 2,495 | 1,866 | 2,336 | 1,513 |
| 2013 | 1,902 | 934 | 650 | 875 | 1,103 | 1,126 | 770 | 919 | 669 | 858 | 936 | 686 |
| 2014 | 967 | 1,016 | 867 | 953 | 1,040 | 1,057 | 787 | 1,194 | 1,306 | 1,034 | 768 | 668 |
| 2015 | 1,097 | 921 | 1,049 | 1,160 | 689 | 626 | 880 | 1,022 | 1,094 | 986 | 1,011 | 1,092 |
| 2016 | 786 | 1,201 | 1,007 | 1,095 | 992 | 1,196 | 1,173 | 799 | 1,077 | 978 | 937 | 611 |
| 2017 | 863 | 1,301 | 1,102 | 890 | 917 | 873 | 1,054 | 702 | 788 | 734 | 603 | 879 |
| 2018 | 584 | 477 | 677 | 1,175 | 1,431 | 1,054 | 863 | 665 | 791 | 1,068 | 812 | 587 |
| 2019 | 1,106 | 807 | 876 | 799 | 899 | 730 | 1,172 | 1,120 | 649 | 756 | 677 | 614 |
| 2020 | 751 | 795 | 749 | 762 | 775 | 630 | 754 | 904 | 658 | 712 | 625 | 598 |
| 2021 | 741 | 615 | 754 | 633 | 729 | 787 | 945 | 946 | 912 | 879 | 646 | 687 |
| 2022 | 670 | 622 | 748 | 863 | 717 | 935 | 677 | 707 | 811 | 681 | 638 | 603 |
| 2023 | 584 | 688 | 573 | 555 | 573 | 640 | 507 | 457 | 392 | 433 | 397 | 379 |
| 2024 | 416 | |||||||||||
| - = No Data Reported; -- = Not Applicable; NA = Not Available; W = Withheld to avoid disclosure of individual company data. |
| Release Date: 3/29/2024 |
| Next Release Date: 4/30/2024 |