|
Download Data (XLS File) |
|
||||||||
|
||||||||
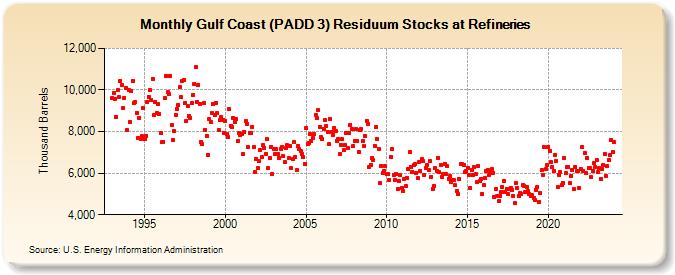
| Gulf Coast (PADD 3) Residuum Stocks at Refineries (Thousand Barrels) | ||||||||
| Year | Jan | Feb | Mar | Apr | May | Jun | Jul | Aug | Sep | Oct | Nov | Dec |
|---|---|---|---|---|---|---|---|---|---|---|---|---|
| 1993 | 9,611 | 9,878 | 9,570 | 8,715 | 9,976 | 9,649 | 10,436 | 10,233 | 9,153 | 9,627 | 10,092 | 8,060 |
| 1994 | 9,988 | 8,477 | 9,932 | 10,448 | 9,357 | 9,413 | 8,915 | 7,710 | 8,667 | 7,638 | 7,770 | 9,142 |
| 1995 | 7,633 | 7,797 | 9,430 | 9,676 | 10,005 | 9,533 | 10,550 | 8,813 | 9,426 | 8,874 | 9,340 | 8,852 |
| 1996 | 7,933 | 7,476 | 7,516 | 9,596 | 10,672 | 9,889 | 9,786 | 10,689 | 8,326 | 7,606 | 8,025 | 8,798 |
| 1997 | 9,084 | 9,270 | 10,127 | 9,645 | 10,435 | 10,488 | 9,378 | 8,502 | 9,220 | 8,765 | 8,667 | 9,357 |
| 1998 | 9,777 | 10,285 | 11,103 | 9,424 | 10,259 | 9,317 | 7,509 | 7,384 | 9,374 | 8,097 | 7,788 | 6,861 |
| 1999 | 8,585 | 8,452 | 8,892 | 9,346 | 8,789 | 9,394 | 8,878 | 8,066 | 8,540 | 8,706 | 8,559 | 7,937 |
| 2000 | 8,506 | 7,888 | 7,741 | 9,063 | 8,289 | 8,233 | 8,644 | 8,475 | 8,590 | 7,554 | 7,920 | 7,856 |
| 2001 | 7,873 | 6,903 | 7,983 | 8,497 | 8,386 | 7,267 | 7,931 | 7,918 | 8,233 | 7,270 | 6,050 | 6,683 |
| 2002 | 6,257 | 6,566 | 7,093 | 6,758 | 7,341 | 7,227 | 6,943 | 7,625 | 6,230 | 6,717 | 7,248 | 5,975 |
| 2003 | 7,164 | 6,921 | 7,140 | 6,928 | 6,716 | 7,161 | 7,267 | 6,804 | 6,516 | 7,188 | 7,330 | 6,705 |
| 2004 | 7,293 | 6,239 | 6,662 | 7,486 | 6,767 | 6,149 | 7,318 | 7,168 | 7,055 | 6,944 | 6,775 | 6,436 |
| 2005 | 8,183 | 7,401 | 7,449 | 7,859 | 7,537 | 7,682 | 7,870 | 8,817 | 8,634 | 9,021 | 8,226 | 7,744 |
| 2006 | 7,630 | 8,139 | 8,557 | 8,284 | 7,962 | 7,379 | 8,617 | 7,984 | 7,849 | 8,183 | 8,020 | 7,563 |
| 2007 | 7,630 | 6,927 | 7,377 | 7,629 | 7,104 | 7,354 | 7,909 | 7,213 | 7,938 | 8,334 | 8,135 | 7,302 |
| 2008 | 7,568 | 8,116 | 7,541 | 7,036 | 8,090 | 8,106 | 7,567 | 7,294 | 7,795 | 8,509 | 8,356 | 6,303 |
| 2009 | 6,413 | 6,732 | 6,626 | 7,311 | 8,239 | 7,627 | 7,161 | 5,505 | 6,355 | 5,988 | 6,088 | 6,342 |
| 2010 | 5,948 | 5,954 | 5,682 | 6,778 | 7,139 | 5,929 | 5,690 | 5,962 | 5,233 | 5,599 | 5,888 | 5,300 |
| 2011 | 5,130 | 5,734 | 5,374 | 5,786 | 6,179 | 7,026 | 6,313 | 6,059 | 6,383 | 6,454 | 6,008 | 5,776 |
| 2012 | 6,558 | 6,110 | 6,679 | 6,570 | 5,925 | 6,258 | 6,396 | 6,127 | 6,561 | 5,826 | 5,252 | 5,394 |
| 2013 | 6,245 | 6,094 | 6,747 | 6,053 | 6,396 | 5,832 | 5,957 | 6,455 | 5,938 | 6,325 | 5,740 | 5,859 |
| 2014 | 5,595 | 5,693 | 5,649 | 5,415 | 5,146 | 4,974 | 5,721 | 6,448 | 6,432 | 6,379 | 6,039 | 6,114 |
| 2015 | 6,264 | 5,912 | 5,302 | 6,162 | 5,918 | 6,301 | 5,945 | 5,563 | 6,364 | 5,617 | 5,738 | 5,009 |
| 2016 | 5,408 | 5,754 | 6,118 | 6,157 | 5,904 | 6,031 | 6,183 | 6,023 | 4,839 | 5,250 | 4,880 | 4,657 |
| 2017 | 4,906 | 5,083 | 5,333 | 5,602 | 5,111 | 5,249 | 4,991 | 5,243 | 5,299 | 5,187 | 4,915 | 4,561 |
| 2018 | 5,536 | 5,301 | 4,893 | 5,034 | 5,001 | 5,417 | 5,360 | 5,116 | 5,348 | 5,133 | 4,988 | 4,877 |
| 2019 | 4,944 | 4,819 | 4,717 | 5,204 | 5,339 | 4,623 | 5,052 | 6,142 | 5,917 | 7,261 | 6,188 | 6,383 |
| 2020 | 7,279 | 7,069 | 6,512 | 6,273 | 6,092 | 6,891 | 6,574 | 5,353 | 5,923 | 6,032 | 5,418 | 5,517 |
| 2021 | 6,735 | 6,005 | 6,290 | 6,305 | 5,522 | 5,871 | 6,174 | 5,236 | 6,304 | 6,094 | 6,104 | 5,290 |
| 2022 | 6,216 | 7,258 | 6,115 | 6,960 | 6,023 | 6,739 | 6,251 | 6,225 | 5,790 | 6,098 | 6,501 | 6,299 |
| 2023 | 6,630 | 6,056 | 6,233 | 5,732 | 6,203 | 6,375 | 6,939 | 5,885 | 6,352 | 6,632 | 6,870 | 7,615 |
| 2024 | 6,995 | |||||||||||
| - = No Data Reported; -- = Not Applicable; NA = Not Available; W = Withheld to avoid disclosure of individual company data. |
| Release Date: 3/29/2024 |
| Next Release Date: 4/30/2024 |