|
Download Data (XLS File) |
|
||||||||
|
||||||||
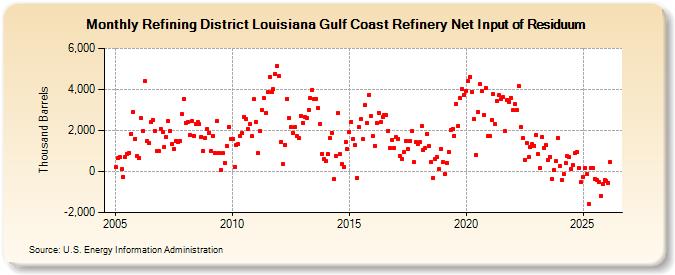
| Refining District Louisiana Gulf Coast Refinery Net Input of Residuum (Thousand Barrels) | ||||||||
| Year | Jan | Feb | Mar | Apr | May | Jun | Jul | Aug | Sep | Oct | Nov | Dec |
|---|---|---|---|---|---|---|---|---|---|---|---|---|
| 2005 | 196 | 646 | 700 | 114 | -256 | 721 | 871 | 912 | 1,841 | 2,911 | 1,594 | 765 |
| 2006 | 641 | 2,593 | 1,979 | 4,391 | 1,482 | 1,413 | 2,389 | 2,529 | 1,976 | 1,013 | 1,020 | 2,084 |
| 2007 | 1,926 | 1,193 | 1,683 | 2,456 | 1,972 | 1,343 | 1,087 | 1,468 | 1,429 | 1,498 | 2,780 | 3,527 |
| 2008 | 2,372 | 2,389 | 1,786 | 2,453 | 1,752 | 2,321 | 2,402 | 2,325 | 1,701 | 994 | 1,646 | 2,074 |
| 2009 | 1,892 | 999 | 1,751 | 920 | 2,467 | 908 | 74 | 882 | 419 | 1,258 | 2,172 | 1,594 |
| 2010 | 1,588 | 224 | 1,292 | 1,321 | 1,741 | 1,861 | 2,675 | 2,554 | 2,067 | 2,313 | 1,725 | 3,513 |
| 2011 | 2,420 | 881 | 1,972 | 3,011 | 3,583 | 2,862 | 3,862 | 4,607 | 3,867 | 4,004 | 4,752 | 5,119 |
| 2012 | 4,641 | 1,451 | 350 | 1,294 | 3,549 | 2,626 | 2,157 | 1,895 | 2,162 | 1,732 | 1,610 | 2,707 |
| 2013 | 2,376 | 2,648 | 2,611 | 3,010 | 3,594 | 3,976 | 3,544 | 3,547 | 3,085 | 2,320 | 878 | 605 |
| 2014 | 501 | 837 | 1,612 | 1,897 | -375 | 778 | 2,851 | 830 | 363 | 232 | 1,434 | 1,116 |
| 2015 | 1,940 | 2,437 | 1,597 | 1,292 | -297 | 2,158 | 2,568 | 1,576 | 3,233 | 2,380 | 3,747 | 2,692 |
| 2016 | 1,728 | 1,262 | 2,354 | 2,865 | 2,389 | 2,649 | 2,758 | 2,739 | 1,993 | 1,142 | 1,555 | 1,151 |
| 2017 | 1,666 | 1,597 | 771 | 629 | 948 | 1,492 | 1,083 | 1,493 | 1,964 | 457 | 1,438 | 1,320 |
| 2018 | 1,417 | 2,212 | 1,033 | 1,125 | 1,835 | 1,229 | 442 | -310 | 620 | 693 | 122 | 1,105 |
| 2019 | 453 | -119 | 403 | 952 | 2,021 | 2,088 | 1,755 | 3,305 | 2,228 | 3,563 | 4,032 | 3,745 |
| 2020 | 3,944 | 4,404 | 4,629 | 3,899 | 2,541 | 806 | 2,907 | 4,241 | 3,909 | 2,767 | 4,067 | 1,730 |
| 2021 | 1,750 | 2,534 | 3,768 | 2,299 | 3,442 | 3,706 | 3,544 | 3,608 | 1,964 | 3,493 | 3,411 | 3,597 |
| 2022 | 2,978 | 3,278 | 2,997 | 4,165 | 2,176 | 1,627 | 580 | 1,396 | 684 | 1,205 | 1,325 | 1,267 |
| 2023 | 1,774 | 851 | 179 | 1,679 | 1,157 | 1,283 | 553 | 730 | -383 | 97 | 518 | 1,652 |
| 2024 | 280 | |||||||||||
| - = No Data Reported; -- = Not Applicable; NA = Not Available; W = Withheld to avoid disclosure of individual company data. |
| Release Date: 3/29/2024 |
| Next Release Date: 4/30/2024 |