|
Download Data (XLS File) |
|
||||||||
|
||||||||
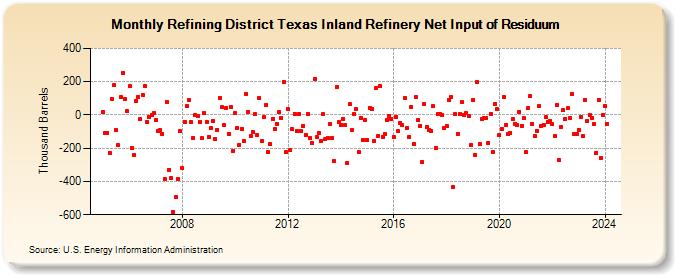
| Refining District Texas Inland Refinery Net Input of Residuum (Thousand Barrels) | ||||||||
| Year | Jan | Feb | Mar | Apr | May | Jun | Jul | Aug | Sep | Oct | Nov | Dec |
|---|---|---|---|---|---|---|---|---|---|---|---|---|
| 2005 | 20 | -109 | -106 | -226 | 98 | 178 | -92 | -183 | 107 | 253 | 93 | 22 |
| 2006 | 171 | -197 | -239 | 85 | 110 | -27 | 120 | 174 | -41 | -15 | 1 | 13 |
| 2007 | -32 | -97 | -91 | -113 | -383 | 79 | -329 | -380 | -582 | -492 | -384 | -99 |
| 2008 | -321 | -40 | 51 | 92 | -44 | -136 | 1 | -9 | -41 | -141 | 13 | -42 |
| 2009 | -130 | -78 | -36 | -144 | -88 | 103 | 45 | -60 | 42 | -112 | 49 | -214 |
| 2010 | 11 | -77 | -179 | -83 | -154 | 128 | 20 | -127 | -100 | 5 | -119 | 103 |
| 2011 | -157 | -14 | 60 | -221 | -175 | -22 | -84 | -56 | 17 | -16 | 199 | -225 |
| 2012 | 35 | -211 | -86 | 8 | -98 | 6 | -94 | -66 | -120 | 7 | -139 | -168 |
| 2013 | 218 | -132 | -106 | -159 | 3 | -145 | -140 | -56 | -136 | -276 | 170 | -44 |
| 2014 | -60 | -22 | -59 | -288 | 64 | -89 | 6 | 35 | -225 | -16 | -151 | -32 |
| 2015 | -151 | 43 | 33 | -155 | 162 | -125 | 172 | -130 | -116 | -31 | -4 | -24 |
| 2016 | -131 | -11 | -99 | -48 | -60 | 101 | -78 | -131 | 49 | -174 | 110 | -29 |
| 2017 | -66 | -282 | 64 | -74 | -89 | -97 | 52 | -197 | 7 | 7 | -2 | -76 |
| 2018 | -68 | 89 | 106 | -433 | 3 | -113 | 5 | 79 | 2 | 10 | -9 | -179 |
| 2019 | 89 | -238 | 199 | -177 | -24 | -21 | -19 | -168 | 6 | -224 | 66 | 35 |
| 2020 | -123 | -82 | 109 | -58 | -112 | -107 | -26 | -53 | -60 | 20 | -65 | -21 |
| 2021 | -225 | 42 | 112 | -53 | -126 | -94 | 52 | -66 | -58 | -15 | -41 | -36 |
| 2022 | -57 | -127 | 58 | -271 | -72 | 27 | -23 | 39 | -18 | 125 | -116 | -113 |
| 2023 | -88 | -10 | -126 | 91 | -37 | 1 | -16 | -56 | -226 | 92 | -257 | 1 |
| 2024 | 54 | |||||||||||
| - = No Data Reported; -- = Not Applicable; NA = Not Available; W = Withheld to avoid disclosure of individual company data. |
| Release Date: 3/29/2024 |
| Next Release Date: 4/30/2024 |