|
Download Data (XLS File) |
|
||||||||
|
||||||||
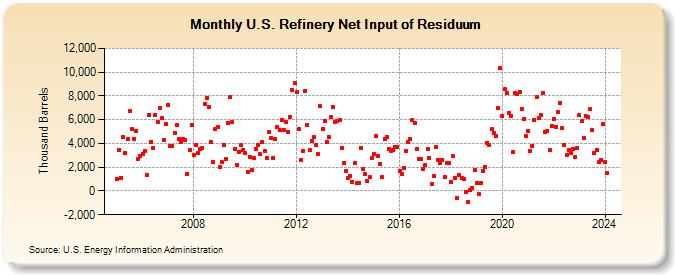
| U.S. Refinery Net Input of Residuum (Thousand Barrels) | ||||||||
| Year | Jan | Feb | Mar | Apr | May | Jun | Jul | Aug | Sep | Oct | Nov | Dec |
|---|---|---|---|---|---|---|---|---|---|---|---|---|
| 2005 | 1,031 | 3,435 | 1,118 | 4,529 | 3,189 | 4,352 | 6,700 | 5,202 | 4,412 | 5,011 | 2,696 | 2,983 |
| 2006 | 3,144 | 3,379 | 1,318 | 6,384 | 4,157 | 3,606 | 6,408 | 5,805 | 6,993 | 6,153 | 4,319 | 5,629 |
| 2007 | 7,268 | 3,756 | 3,796 | 4,886 | 5,521 | 4,371 | 4,094 | 4,403 | 4,262 | 1,449 | 3,451 | 5,526 |
| 2008 | 3,005 | 3,838 | 3,213 | 3,513 | 3,650 | 7,325 | 7,816 | 7,088 | 4,092 | 2,454 | 5,199 | 5,367 |
| 2009 | 1,988 | 2,403 | 3,906 | 2,666 | 5,697 | 7,915 | 5,795 | 3,551 | 2,213 | 3,317 | 3,850 | 3,431 |
| 2010 | 3,179 | 1,591 | 2,887 | 1,758 | 2,771 | 3,523 | 3,842 | 3,072 | 4,085 | 3,373 | 2,813 | 4,928 |
| 2011 | 4,453 | 2,791 | 4,382 | 5,369 | 5,096 | 6,014 | 5,141 | 5,828 | 4,992 | 6,206 | 8,514 | 9,089 |
| 2012 | 8,363 | 5,255 | 2,641 | 3,389 | 8,428 | 5,553 | 3,456 | 4,246 | 4,541 | 3,888 | 3,118 | 7,118 |
| 2013 | 5,196 | 5,898 | 4,084 | 4,534 | 6,236 | 7,028 | 5,772 | 5,893 | 5,943 | 3,592 | 2,381 | 1,716 |
| 2014 | 1,123 | 1,269 | 785 | 2,327 | 645 | 692 | 3,580 | 1,831 | 1,409 | 799 | 1,165 | 2,775 |
| 2015 | 3,101 | 4,643 | 2,957 | 2,274 | 1,154 | 4,375 | 4,582 | 3,536 | 3,388 | 3,430 | 3,732 | 3,664 |
| 2016 | 1,717 | 1,393 | 1,959 | 3,359 | 4,111 | 4,354 | 5,933 | 5,742 | 3,528 | 2,682 | 2,729 | 1,879 |
| 2017 | 2,145 | 3,517 | 2,735 | 559 | 1,249 | 3,690 | 2,631 | 2,376 | 2,616 | 1,169 | 2,394 | 2,314 |
| 2018 | 775 | 2,907 | 1,116 | -598 | 1,368 | 1,060 | 973 | -53 | -889 | 55 | 264 | 1,723 |
| 2019 | 648 | -279 | 629 | 1,709 | 2,013 | 4,048 | 3,838 | 5,183 | 4,872 | 4,640 | 6,950 | 10,338 |
| 2020 | 6,341 | 8,594 | 8,233 | 6,580 | 6,334 | 3,240 | 8,257 | 8,172 | 8,355 | 6,906 | 6,076 | 4,663 |
| 2021 | 5,024 | 3,335 | 3,811 | 5,934 | 7,901 | 6,118 | 6,414 | 8,250 | 4,991 | 5,070 | 3,438 | 5,481 |
| 2022 | 6,055 | 5,412 | 6,680 | 7,400 | 5,311 | 3,854 | 3,000 | 3,421 | 3,206 | 3,546 | 2,860 | 3,612 |
| 2023 | 6,370 | 5,865 | 4,460 | 6,331 | 6,198 | 6,863 | 5,130 | 3,229 | 3,450 | 2,401 | 2,609 | 5,623 |
| 2024 | 2,464 | |||||||||||
| - = No Data Reported; -- = Not Applicable; NA = Not Available; W = Withheld to avoid disclosure of individual company data. |
| Release Date: 3/29/2024 |
| Next Release Date: 4/30/2024 |