|
Download Data (XLS File) |
|
||||||||
|
||||||||
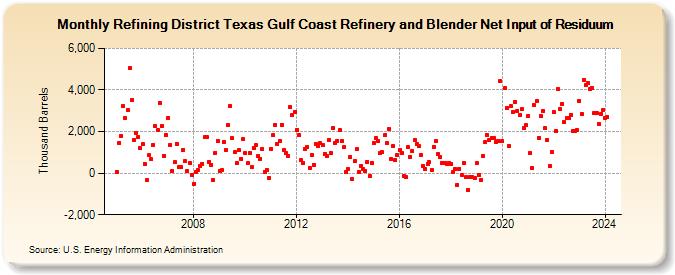
| Refining District Texas Gulf Coast Refinery and Blender Net Input of Residuum (Thousand Barrels) | ||||||||
| Year | Jan | Feb | Mar | Apr | May | Jun | Jul | Aug | Sep | Oct | Nov | Dec |
|---|---|---|---|---|---|---|---|---|---|---|---|---|
| 2005 | 70 | 1,457 | 1,808 | 3,213 | 2,628 | 3,043 | 5,052 | 3,515 | 1,610 | 1,939 | 1,727 | 1,190 |
| 2006 | 1,383 | 447 | -344 | 855 | 662 | 1,361 | 2,252 | 2,054 | 3,379 | 2,269 | 845 | 1,823 |
| 2007 | 2,673 | 1,360 | 109 | 513 | 1,420 | 280 | 292 | 1,136 | 563 | 96 | 491 | -66 |
| 2008 | -501 | 64 | 145 | 350 | 458 | 1,724 | 1,719 | 537 | 397 | -337 | 989 | 1,557 |
| 2009 | 124 | 139 | 1,512 | 1,130 | 2,315 | 3,226 | 1,679 | 1,006 | 498 | 1,112 | 682 | 1,637 |
| 2010 | 950 | 484 | 973 | 277 | 1,231 | 1,333 | 822 | 701 | 1,149 | 74 | 170 | -212 |
| 2011 | 1,151 | 1,821 | 2,339 | 1,412 | 1,554 | 2,330 | 1,120 | 980 | 826 | 3,195 | 2,803 | 2,934 |
| 2012 | 2,093 | 1,819 | 630 | 509 | 1,165 | 1,266 | 255 | 854 | 412 | 1,413 | 1,283 | 1,429 |
| 2013 | 1,352 | 940 | 829 | 1,594 | 962 | 2,150 | 1,454 | 1,563 | 2,054 | 1,533 | 1,242 | 53 |
| 2014 | 199 | 770 | -299 | 565 | 1,148 | 50 | 357 | 185 | 112 | 548 | -134 | 489 |
| 2015 | 1,467 | 1,688 | 1,533 | 964 | 996 | 1,822 | 1,447 | 2,132 | 679 | 1,304 | 628 | 864 |
| 2016 | 1,101 | 964 | -146 | -205 | 1,244 | 795 | 1,046 | 1,578 | 1,410 | 1,292 | 889 | 336 |
| 2017 | 198 | 431 | 521 | 152 | 1,273 | 1,528 | 928 | 782 | 505 | 502 | 441 | 509 |
| 2018 | 455 | 68 | 191 | -550 | 205 | -73 | 466 | -193 | -804 | -166 | -177 | -253 |
| 2019 | 473 | -97 | -327 | 810 | 1,475 | 1,830 | 1,570 | 1,713 | 1,675 | 1,511 | 1,551 | 4,412 |
| 2020 | 1,542 | 4,073 | 3,139 | 1,313 | 3,208 | 2,943 | 3,439 | 2,998 | 2,783 | 3,065 | 2,152 | 2,303 |
| 2021 | 2,761 | 958 | 248 | 3,257 | 3,449 | 1,706 | 2,760 | 2,997 | 2,148 | 1,599 | 338 | 1,014 |
| 2022 | 2,932 | 2,023 | 4,044 | 3,070 | 3,345 | 2,443 | 2,642 | 2,649 | 2,816 | 2,042 | 2,034 | 2,061 |
| 2023 | 3,470 | 2,865 | 4,479 | 4,230 | 4,328 | 4,047 | 4,080 | 2,894 | 2,869 | 2,344 | 2,863 | 3,023 |
| 2024 | 2,649 | |||||||||||
| - = No Data Reported; -- = Not Applicable; NA = Not Available; W = Withheld to avoid disclosure of individual company data. |
| Release Date: 3/29/2024 |
| Next Release Date: 4/30/2024 |