|
Download Data (XLS File) |
|
||||||||
|
||||||||
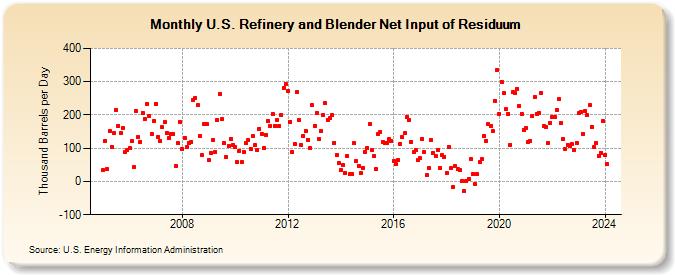
| U.S. Refinery and Blender Net Input of Residuum (Thousand Barrels per Day) | ||||||||
| Year | Jan | Feb | Mar | Apr | May | Jun | Jul | Aug | Sep | Oct | Nov | Dec |
|---|---|---|---|---|---|---|---|---|---|---|---|---|
| 2005 | 33 | 123 | 36 | 151 | 103 | 145 | 216 | 168 | 147 | 162 | 90 | 96 |
| 2006 | 101 | 121 | 43 | 213 | 134 | 120 | 207 | 187 | 233 | 198 | 144 | 182 |
| 2007 | 234 | 134 | 122 | 163 | 178 | 146 | 132 | 142 | 142 | 47 | 115 | 178 |
| 2008 | 97 | 132 | 104 | 117 | 118 | 244 | 252 | 229 | 136 | 79 | 173 | 173 |
| 2009 | 65 | 86 | 126 | 89 | 184 | 264 | 187 | 115 | 74 | 107 | 129 | 111 |
| 2010 | 103 | 57 | 93 | 59 | 89 | 117 | 124 | 99 | 136 | 109 | 94 | 159 |
| 2011 | 144 | 100 | 141 | 181 | 167 | 204 | 167 | 186 | 167 | 200 | 281 | 293 |
| 2012 | 272 | 180 | 88 | 112 | 268 | 186 | 110 | 137 | 152 | 126 | 100 | 229 |
| 2013 | 168 | 207 | 128 | 151 | 201 | 235 | 186 | 190 | 199 | 117 | 79 | 55 |
| 2014 | 34 | 49 | 26 | 77 | 21 | 23 | 115 | 62 | 47 | 25 | 41 | 90 |
| 2015 | 100 | 172 | 96 | 76 | 37 | 143 | 149 | 120 | 115 | 117 | 127 | 122 |
| 2016 | 62 | 51 | 65 | 114 | 133 | 145 | 193 | 186 | 118 | 89 | 94 | 64 |
| 2017 | 70 | 128 | 88 | 19 | 41 | 124 | 86 | 78 | 95 | 40 | 80 | 75 |
| 2018 | 25 | 104 | 39 | -16 | 46 | 36 | 34 | 2 | -29 | 2 | 8 | 67 |
| 2019 | 23 | -8 | 21 | 59 | 66 | 137 | 122 | 172 | 166 | 151 | 243 | 336 |
| 2020 | 203 | 300 | 266 | 217 | 204 | 111 | 268 | 266 | 279 | 227 | 204 | 155 |
| 2021 | 162 | 119 | 123 | 198 | 255 | 204 | 207 | 266 | 166 | 164 | 115 | 177 |
| 2022 | 195 | 193 | 215 | 247 | 176 | 128 | 97 | 110 | 107 | 114 | 95 | 117 |
| 2023 | 205 | 209 | 144 | 211 | 200 | 229 | 165 | 104 | 115 | 77 | 87 | 181 |
| 2024 | 79 | |||||||||||
| - = No Data Reported; -- = Not Applicable; NA = Not Available; W = Withheld to avoid disclosure of individual company data. |
| Release Date: 3/29/2024 |
| Next Release Date: 4/30/2024 |