|
Download Data (XLS File) |
|
||||||||
|
||||||||
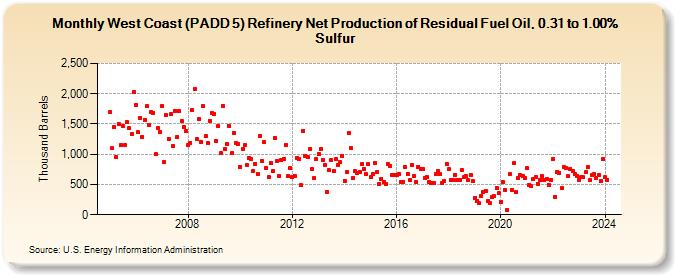
| West Coast (PADD 5) Refinery Net Production of Residual Fuel Oil, 0.31 to 1.00% Sulfur (Thousand Barrels) | ||||||||
| Year | Jan | Feb | Mar | Apr | May | Jun | Jul | Aug | Sep | Oct | Nov | Dec |
|---|---|---|---|---|---|---|---|---|---|---|---|---|
| 2005 | 1,702 | 1,095 | 1,444 | 948 | 1,498 | 1,156 | 1,462 | 1,152 | 1,526 | 1,426 | 1,341 | 2,033 |
| 2006 | 1,818 | 1,361 | 1,594 | 1,289 | 1,569 | 1,790 | 1,475 | 1,702 | 1,689 | 999 | 1,436 | 1,366 |
| 2007 | 1,800 | 875 | 1,646 | 1,248 | 1,659 | 1,140 | 1,719 | 1,282 | 1,707 | 1,553 | 1,457 | 1,383 |
| 2008 | 1,148 | 1,187 | 1,726 | 2,075 | 1,246 | 1,584 | 1,210 | 1,801 | 1,297 | 1,188 | 1,554 | 1,683 |
| 2009 | 1,673 | 1,219 | 1,469 | 1,016 | 1,805 | 1,082 | 1,162 | 1,464 | 1,012 | 1,351 | 1,187 | 1,164 |
| 2010 | 789 | 1,093 | 1,145 | 815 | 942 | 918 | 729 | 842 | 677 | 1,302 | 894 | 1,195 |
| 2011 | 776 | 622 | 853 | 722 | 1,275 | 888 | 648 | 903 | 929 | 1,159 | 644 | 766 |
| 2012 | 617 | 645 | 943 | 921 | 489 | 1,388 | 968 | 952 | 1,088 | 759 | 607 | 923 |
| 2013 | 1,000 | 1,082 | 908 | 825 | 382 | 734 | 904 | 724 | 918 | 818 | 867 | 976 |
| 2014 | 558 | 709 | 1,350 | 1,098 | 604 | 715 | 690 | 712 | 846 | 754 | 667 | 832 |
| 2015 | 616 | 672 | 860 | 710 | 515 | 596 | 546 | 502 | 832 | 811 | 654 | 650 |
| 2016 | 655 | 670 | 544 | 544 | 790 | 678 | 567 | 826 | 642 | 548 | 793 | 760 |
| 2017 | 753 | 614 | 617 | 541 | 527 | 520 | 666 | 724 | 665 | 518 | 556 | 844 |
| 2018 | 749 | 575 | 570 | 664 | 576 | 581 | 736 | 625 | 637 | 572 | 664 | 551 |
| 2019 | 282 | 224 | 190 | 312 | 380 | 395 | 225 | 187 | 285 | 305 | 446 | 353 |
| 2020 | 218 | 536 | 407 | 77 | 667 | 415 | 849 | 371 | 601 | 655 | 640 | 609 |
| 2021 | 767 | 498 | 473 | 593 | 618 | 516 | 579 | 634 | 580 | 585 | 493 | 572 |
| 2022 | 918 | 298 | 713 | 694 | 447 | 787 | 766 | 636 | 758 | 727 | 672 | 648 |
| 2023 | 571 | 627 | 616 | 699 | 784 | 567 | 658 | 676 | 610 | 660 | 561 | 920 |
| 2024 | 620 | |||||||||||
| - = No Data Reported; -- = Not Applicable; NA = Not Available; W = Withheld to avoid disclosure of individual company data. |
| Release Date: 3/29/2024 |
| Next Release Date: 4/30/2024 |