|
Download Data (XLS File) |
|
||||||||
|
||||||||
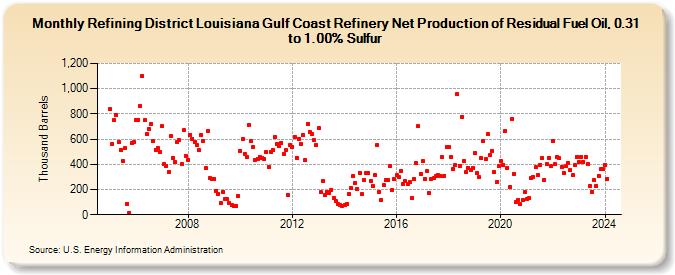
| Refining District Louisiana Gulf Coast Refinery Net Production of Residual Fuel Oil, 0.31 to 1.00% Sulfur (Thousand Barrels) | ||||||||
| Year | Jan | Feb | Mar | Apr | May | Jun | Jul | Aug | Sep | Oct | Nov | Dec |
|---|---|---|---|---|---|---|---|---|---|---|---|---|
| 2005 | 836 | 565 | 752 | 791 | 575 | 514 | 426 | 529 | 87 | 14 | 569 | 577 |
| 2006 | 755 | 755 | 861 | 1,099 | 748 | 641 | 681 | 718 | 581 | 517 | 526 | 497 |
| 2007 | 700 | 400 | 387 | 338 | 621 | 453 | 422 | 575 | 589 | 401 | 669 | 468 |
| 2008 | 437 | 633 | 604 | 578 | 553 | 513 | 633 | 584 | 369 | 661 | 291 | 286 |
| 2009 | 284 | 191 | 165 | 93 | 184 | 125 | 121 | 89 | 76 | 71 | 71 | 149 |
| 2010 | 509 | 602 | 484 | 461 | 710 | 585 | 541 | 437 | 446 | 460 | 449 | 440 |
| 2011 | 496 | 378 | 499 | 517 | 614 | 565 | 544 | 569 | 484 | 514 | 155 | 553 |
| 2012 | 540 | 619 | 452 | 603 | 563 | 633 | 433 | 720 | 656 | 642 | 590 | 552 |
| 2013 | 685 | 178 | 267 | 157 | 184 | 173 | 200 | 135 | 105 | 87 | 78 | 73 |
| 2014 | 77 | 88 | 167 | 213 | 304 | 255 | 205 | 334 | 162 | 272 | 331 | 330 |
| 2015 | 268 | 227 | 315 | 555 | 181 | 114 | 232 | 273 | 279 | 385 | 198 | 281 |
| 2016 | 314 | 300 | 348 | 242 | 267 | 241 | 260 | 131 | 286 | 408 | 701 | 326 |
| 2017 | 426 | 282 | 346 | 171 | 285 | 290 | 304 | 315 | 306 | 457 | 311 | 537 |
| 2018 | 536 | 456 | 365 | 391 | 956 | 385 | 779 | 430 | 338 | 374 | 351 | 374 |
| 2019 | 488 | 329 | 297 | 447 | 588 | 441 | 638 | 475 | 505 | 337 | 259 | 388 |
| 2020 | 425 | 397 | 668 | 371 | 218 | 763 | 327 | 102 | 119 | 83 | 118 | 184 |
| 2021 | 128 | 132 | 293 | 302 | 375 | 314 | 395 | 449 | 277 | 399 | 449 | 390 |
| 2022 | 584 | 404 | 456 | 447 | 380 | 332 | 383 | 414 | 354 | 312 | 391 | 461 |
| 2023 | 416 | 461 | 422 | 459 | 399 | 231 | 184 | 273 | 226 | 310 | 359 | 359 |
| 2024 | 398 | |||||||||||
| - = No Data Reported; -- = Not Applicable; NA = Not Available; W = Withheld to avoid disclosure of individual company data. |
| Release Date: 3/29/2024 |
| Next Release Date: 4/30/2024 |