|
Download Data (XLS File) |
|
||||||||
|
||||||||
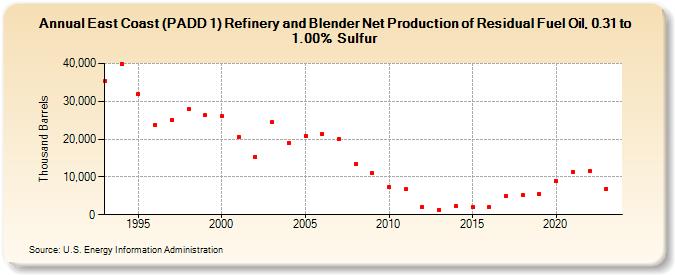
| East Coast (PADD 1) Refinery and Blender Net Production of Residual Fuel Oil, 0.31 to 1.00% Sulfur (Thousand Barrels) | ||||||||
| Decade | Year-0 | Year-1 | Year-2 | Year-3 | Year-4 | Year-5 | Year-6 | Year-7 | Year-8 | Year-9 |
|---|---|---|---|---|---|---|---|---|---|---|
| 1990's | 35,322 | 39,944 | 31,890 | 23,749 | 25,134 | 27,927 | 26,245 | |||
| 2000's | 25,999 | 20,570 | 15,331 | 24,498 | 19,013 | 20,878 | 21,397 | 20,143 | 13,404 | 10,903 |
| 2010's | 7,352 | 6,676 | 1,991 | 1,367 | 2,183 | 2,106 | 1,974 | 4,964 | 5,220 | 5,528 |
| 2020's | 8,896 | 11,301 | 11,612 | 6,829 |
| - = No Data Reported; -- = Not Applicable; NA = Not Available; W = Withheld to avoid disclosure of individual company data. |
| Release Date: 3/29/2024 |
| Next Release Date: 8/30/2024 |