|
Download Data (XLS File) |
|
||||||||
|
||||||||
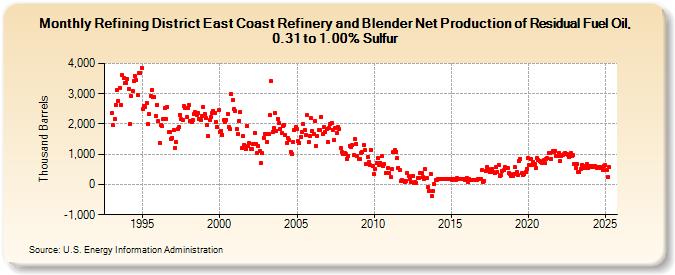
| Refining District East Coast Refinery and Blender Net Production of Residual Fuel Oil, 0.31 to 1.00% Sulfur (Thousand Barrels) | ||||||||
| Year | Jan | Feb | Mar | Apr | May | Jun | Jul | Aug | Sep | Oct | Nov | Dec |
|---|---|---|---|---|---|---|---|---|---|---|---|---|
| 1993 | 2,361 | 1,955 | 2,156 | 2,643 | 3,135 | 2,765 | 3,181 | 2,641 | 3,613 | 3,528 | 3,368 | 3,368 |
| 1994 | 3,485 | 3,170 | 1,985 | 2,914 | 3,092 | 3,418 | 3,587 | 3,457 | 2,962 | 3,691 | 3,695 | 3,858 |
| 1995 | 2,486 | 2,598 | 2,560 | 2,699 | 1,990 | 2,320 | 2,914 | 3,116 | 2,881 | 2,881 | 2,262 | 2,634 |
| 1996 | 2,089 | 1,380 | 1,952 | 1,924 | 2,155 | 2,528 | 2,174 | 2,559 | 1,719 | 1,745 | 1,499 | 1,538 |
| 1997 | 1,802 | 1,206 | 1,403 | 1,846 | 1,890 | 2,312 | 2,149 | 2,137 | 2,582 | 2,538 | 2,228 | 2,528 |
| 1998 | 2,631 | 2,097 | 2,055 | 2,132 | 2,315 | 2,392 | 2,306 | 2,370 | 2,159 | 2,127 | 2,272 | 2,571 |
| 1999 | 2,334 | 2,184 | 1,963 | 1,589 | 2,119 | 2,230 | 2,370 | 2,436 | 2,375 | 2,077 | 1,902 | 2,452 |
| 2000 | 1,742 | 1,769 | 1,644 | 2,121 | 2,056 | 2,141 | 2,330 | 1,884 | 1,818 | 2,988 | 2,786 | 2,484 |
| 2001 | 2,439 | 1,830 | 1,671 | 2,103 | 2,393 | 1,198 | 1,601 | 1,317 | 1,172 | 1,946 | 1,270 | 1,369 |
| 2002 | 1,175 | 1,169 | 1,332 | 1,712 | 1,347 | 1,043 | 1,279 | 1,112 | 714 | 1,027 | 1,549 | 1,670 |
| 2003 | 1,658 | 1,402 | 1,666 | 2,293 | 3,420 | 1,744 | 1,874 | 2,366 | 1,777 | 2,165 | 2,032 | 1,835 |
| 2004 | 1,694 | 1,927 | 1,960 | 1,644 | 1,363 | 1,533 | 1,462 | 1,088 | 1,016 | 1,396 | 1,791 | 1,894 |
| 2005 | 1,837 | 1,435 | 1,377 | 1,584 | 1,731 | 1,998 | 1,810 | 1,632 | 2,284 | 1,390 | 1,618 | 2,182 |
| 2006 | 1,772 | 1,654 | 2,089 | 1,276 | 1,590 | 1,812 | 1,795 | 2,242 | 1,683 | 1,886 | 1,749 | 1,849 |
| 2007 | 1,396 | 1,860 | 1,985 | 2,029 | 1,810 | 1,471 | 1,862 | 1,708 | 1,914 | 1,842 | 1,195 | 1,071 |
| 2008 | 1,020 | 1,048 | 1,002 | 841 | 954 | 1,281 | 1,233 | 1,296 | 963 | 1,494 | 1,346 | 926 |
| 2009 | 840 | 827 | 1,050 | 1,067 | 1,310 | 1,125 | 675 | 910 | 736 | 632 | 1,132 | 600 |
| 2010 | 344 | 509 | 717 | 868 | 652 | 725 | 939 | 616 | 676 | 373 | 392 | 541 |
| 2011 | 384 | 253 | 497 | 1,068 | 1,125 | 1,086 | 870 | 543 | 470 | 102 | 147 | 120 |
| 2012 | 85 | 119 | 382 | 269 | 185 | 66 | 273 | 42 | 66 | 37 | 213 | 229 |
| 2013 | 369 | 368 | 237 | 179 | 499 | 224 | -85 | -205 | 347 | -386 | -221 | 15 |
| 2014 | 153 | 155 | 189 | 186 | 172 | 192 | 190 | 187 | 178 | 197 | 190 | 191 |
| 2015 | 171 | 153 | 178 | 168 | 162 | 199 | 183 | 183 | 166 | 171 | 190 | 162 |
| 2016 | 216 | 82 | 177 | 153 | 160 | 162 | 164 | 164 | 158 | 165 | 193 | 180 |
| 2017 | 471 | 94 | 130 | 452 | 581 | 515 | 408 | 456 | 514 | 405 | 368 | 564 |
| 2018 | 414 | 651 | 291 | 297 | 454 | 469 | 561 | 545 | 556 | 376 | 337 | 267 |
| 2019 | 292 | 345 | 569 | 405 | 325 | 766 | 856 | 368 | 315 | 339 | 410 | 527 |
| 2020 | 868 | 630 | 839 | 658 | 750 | 686 | 542 | 866 | 817 | 775 | 744 | 716 |
| 2021 | 806 | 698 | 857 | 869 | 1,030 | 1,034 | 857 | 1,093 | 1,058 | 1,120 | 929 | 942 |
| 2022 | 1,040 | 778 | 949 | 987 | 994 | 1,053 | 993 | 978 | 917 | 1,032 | 927 | 958 |
| 2023 | 666 | 555 | 673 | 408 | 396 | 523 | 659 | 543 | 552 | 626 | 662 | 555 |
| 2024 | 617 | 574 | 597 | 561 | 601 | 593 | ||||||
| - = No Data Reported; -- = Not Applicable; NA = Not Available; W = Withheld to avoid disclosure of individual company data. |
| Release Date: 8/30/2024 |
| Next Release Date: 9/30/2024 |