|
Download Data (XLS File) |
|
||||||||
|
||||||||
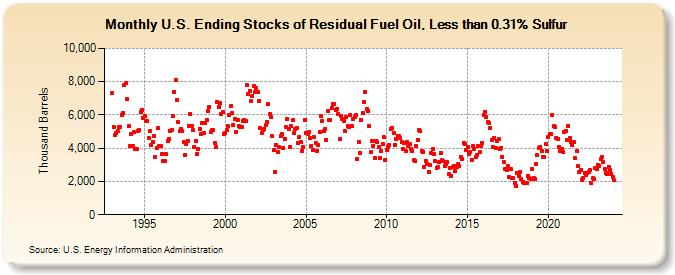
| U.S. Ending Stocks of Residual Fuel Oil, Less than 0.31% Sulfur (Thousand Barrels) | ||||||||
| Year | Jan | Feb | Mar | Apr | May | Jun | Jul | Aug | Sep | Oct | Nov | Dec |
|---|---|---|---|---|---|---|---|---|---|---|---|---|
| 1993 | 7,328 | 5,289 | 4,767 | 4,906 | 5,023 | 5,253 | 5,280 | 6,018 | 6,105 | 7,777 | 7,934 | 6,951 |
| 1994 | 5,317 | 4,113 | 4,845 | 4,116 | 4,962 | 3,970 | 3,973 | 5,044 | 5,083 | 6,186 | 6,286 | 5,799 |
| 1995 | 5,928 | 5,650 | 5,606 | 4,614 | 5,031 | 4,213 | 4,398 | 4,743 | 3,449 | 4,038 | 5,188 | 4,134 |
| 1996 | 4,106 | 3,667 | 3,225 | 3,236 | 3,631 | 4,453 | 4,572 | 5,049 | 5,073 | 5,950 | 7,406 | 8,089 |
| 1997 | 6,921 | 5,545 | 5,028 | 5,136 | 5,021 | 4,342 | 3,586 | 4,241 | 4,404 | 5,361 | 6,060 | 5,362 |
| 1998 | 5,078 | 4,059 | 4,432 | 3,675 | 3,978 | 5,183 | 4,840 | 5,489 | 4,938 | 5,542 | 5,699 | 6,207 |
| 1999 | 6,450 | 4,985 | 5,071 | 5,118 | 4,320 | 4,073 | 6,791 | 6,502 | 6,716 | 6,069 | 6,147 | 4,869 |
| 2000 | 4,900 | 5,093 | 5,310 | 5,994 | 6,526 | 6,087 | 5,423 | 5,782 | 4,964 | 5,702 | 5,354 | 5,268 |
| 2001 | 5,286 | 5,635 | 5,724 | 5,607 | 7,789 | 7,267 | 7,455 | 6,807 | 7,148 | 7,718 | 7,392 | 7,594 |
| 2002 | 7,366 | 6,831 | 5,190 | 4,914 | 5,117 | 5,161 | 5,367 | 5,582 | 6,636 | 6,041 | 5,849 | 4,732 |
| 2003 | 3,898 | 2,570 | 4,168 | 3,771 | 4,057 | 4,723 | 4,864 | 4,002 | 4,579 | 5,261 | 5,763 | 5,182 |
| 2004 | 4,052 | 5,347 | 5,667 | 4,893 | 5,179 | 5,213 | 4,294 | 4,693 | 4,358 | 3,848 | 4,076 | 5,666 |
| 2005 | 4,926 | 4,847 | 4,944 | 4,599 | 4,149 | 3,884 | 4,655 | 4,332 | 3,860 | 4,207 | 4,989 | 5,931 |
| 2006 | 5,661 | 5,021 | 5,137 | 4,491 | 6,214 | 5,681 | 5,698 | 6,437 | 6,648 | 6,643 | 6,280 | 6,381 |
| 2007 | 6,083 | 4,542 | 5,943 | 5,739 | 5,631 | 5,027 | 5,885 | 5,324 | 5,298 | 6,005 | 5,348 | 5,766 |
| 2008 | 5,866 | 5,973 | 3,336 | 4,392 | 3,721 | 5,694 | 6,091 | 6,789 | 7,371 | 6,371 | 6,265 | 5,312 |
| 2009 | 3,743 | 4,450 | 4,138 | 3,420 | 4,459 | 4,364 | 4,093 | 3,403 | 3,827 | 4,243 | 4,661 | 3,302 |
| 2010 | 3,905 | 4,098 | 4,213 | 5,141 | 5,240 | 4,887 | 4,215 | 4,541 | 4,709 | 4,704 | 4,600 | 4,371 |
| 2011 | 3,978 | 4,296 | 3,815 | 4,344 | 4,134 | 4,241 | 3,928 | 3,830 | 3,272 | 3,253 | 4,109 | 4,516 |
| 2012 | 5,117 | 5,039 | 3,826 | 3,773 | 2,883 | 3,222 | 3,051 | 2,562 | 2,964 | 3,684 | 3,940 | 3,673 |
| 2013 | 3,212 | 2,818 | 2,866 | 3,168 | 3,704 | 3,269 | 3,218 | 2,912 | 3,079 | 3,167 | 2,449 | 2,803 |
| 2014 | 2,353 | 2,844 | 2,934 | 2,617 | 2,874 | 3,052 | 2,946 | 3,478 | 3,366 | 4,330 | 4,222 | 3,867 |
| 2015 | 4,058 | 3,664 | 3,797 | 3,311 | 4,123 | 3,951 | 3,468 | 3,584 | 4,108 | 3,756 | 4,118 | 4,304 |
| 2016 | 5,993 | 6,148 | 5,878 | 5,575 | 5,513 | 5,203 | 4,466 | 4,093 | 4,642 | 3,993 | 4,411 | 4,528 |
| 2017 | 3,922 | 4,040 | 3,499 | 3,154 | 2,760 | 2,684 | 2,923 | 2,274 | 2,768 | 2,212 | 2,181 | 1,928 |
| 2018 | 1,756 | 2,483 | 2,343 | 2,592 | 2,134 | 1,962 | 1,933 | 1,905 | 1,912 | 2,339 | 2,189 | 2,145 |
| 2019 | 2,742 | 2,205 | 2,168 | 3,037 | 3,589 | 3,984 | 4,044 | 3,822 | 3,456 | 3,446 | 4,231 | 3,801 |
| 2020 | 4,654 | 4,880 | 4,880 | 5,987 | 5,312 | 5,250 | 4,635 | 4,570 | 4,074 | 3,860 | 3,963 | 3,792 |
| 2021 | 4,965 | 5,021 | 4,478 | 5,363 | 4,639 | 4,379 | 4,165 | 4,366 | 3,389 | 3,820 | 2,914 | 2,540 |
| 2022 | 2,700 | 2,088 | 2,234 | 2,507 | 2,369 | 2,492 | 2,582 | 2,674 | 1,887 | 2,191 | 2,122 | 2,780 |
| 2023 | 2,762 | 2,981 | 2,933 | 3,370 | 3,489 | 3,175 | 2,775 | 2,533 | 2,443 | 2,890 | 2,699 | 2,442 |
| 2024 | 2,273 | |||||||||||
| - = No Data Reported; -- = Not Applicable; NA = Not Available; W = Withheld to avoid disclosure of individual company data. |
| Release Date: 3/29/2024 |
| Next Release Date: 4/30/2024 |