|
Download Data (XLS File) |
|
||||||||
|
||||||||
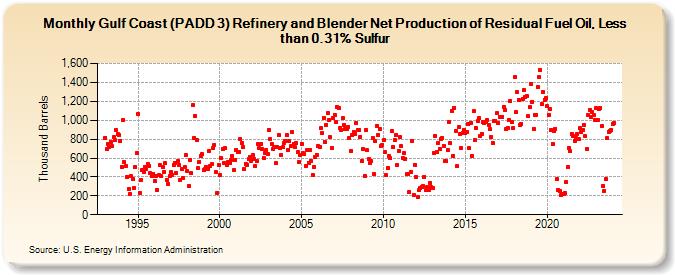
| Gulf Coast (PADD 3) Refinery and Blender Net Production of Residual Fuel Oil, Less than 0.31% Sulfur (Thousand Barrels) | ||||||||
| Year | Jan | Feb | Mar | Apr | May | Jun | Jul | Aug | Sep | Oct | Nov | Dec |
|---|---|---|---|---|---|---|---|---|---|---|---|---|
| 1993 | 816 | 696 | 744 | 720 | 774 | 723 | 824 | 786 | 892 | 856 | 841 | 783 |
| 1994 | 509 | 1,001 | 553 | 520 | 402 | 272 | 221 | 406 | 373 | 287 | 509 | 654 |
| 1995 | 1,070 | 231 | 362 | 474 | 456 | 507 | 483 | 536 | 518 | 441 | 405 | 434 |
| 1996 | 358 | 413 | 261 | 417 | 523 | 410 | 504 | 455 | 542 | 370 | 327 | 408 |
| 1997 | 453 | 423 | 527 | 551 | 446 | 567 | 525 | 368 | 481 | 391 | 505 | 630 |
| 1998 | 463 | 309 | 580 | 437 | 1,158 | 814 | 1,048 | 789 | 490 | 561 | 623 | 638 |
| 1999 | 475 | 484 | 503 | 485 | 674 | 513 | 532 | 703 | 739 | 450 | 235 | 528 |
| 2000 | 420 | 597 | 694 | 542 | 702 | 530 | 562 | 550 | 579 | 622 | 472 | 580 |
| 2001 | 688 | 661 | 668 | 799 | 757 | 714 | 486 | 540 | 531 | 586 | 614 | 573 |
| 2002 | 630 | 587 | 517 | 563 | 747 | 701 | 746 | 693 | 603 | 653 | 685 | 643 |
| 2003 | 898 | 797 | 750 | 692 | 716 | 544 | 717 | 844 | 701 | 630 | 716 | 759 |
| 2004 | 779 | 843 | 689 | 779 | 726 | 873 | 750 | 713 | 754 | 660 | 555 | 630 |
| 2005 | 753 | 649 | 642 | 511 | 681 | 548 | 685 | 571 | 425 | 508 | 608 | 636 |
| 2006 | 726 | 715 | 915 | 861 | 1,022 | 769 | 952 | 1,077 | 1,005 | 819 | 708 | 1,027 |
| 2007 | 1,059 | 976 | 1,137 | 1,131 | 917 | 898 | 1,020 | 948 | 904 | 909 | 929 | 816 |
| 2008 | 677 | 842 | 878 | 854 | 975 | 901 | 899 | 825 | 573 | 693 | 412 | 901 |
| 2009 | 680 | 588 | 547 | 566 | 812 | 429 | 776 | 943 | 848 | 904 | 726 | 742 |
| 2010 | 792 | 659 | 416 | 496 | 620 | 595 | 883 | 712 | 792 | 843 | 527 | 679 |
| 2011 | 820 | 722 | 601 | 648 | 592 | 426 | 436 | 238 | 447 | 780 | 211 | 529 |
| 2012 | 401 | 184 | 257 | 284 | 295 | 303 | 403 | 259 | 290 | 262 | 333 | 291 |
| 2013 | 280 | 656 | 834 | 665 | 763 | 700 | 800 | 812 | 732 | 566 | 567 | 683 |
| 2014 | 983 | 754 | 1,101 | 622 | 1,132 | 889 | 511 | 923 | 853 | 704 | 866 | 899 |
| 2015 | 862 | 873 | 957 | 701 | 973 | 622 | 1,093 | 790 | 914 | 992 | 1,021 | 837 |
| 2016 | 857 | 976 | 975 | 982 | 1,001 | 946 | 904 | 822 | 759 | 989 | 996 | 1,076 |
| 2017 | 971 | 1,038 | 1,031 | 1,037 | 1,141 | 1,112 | 911 | 917 | 1,000 | 1,198 | 976 | 916 |
| 2018 | 1,455 | 1,084 | 1,293 | 1,217 | 944 | 965 | 1,227 | 1,318 | 1,249 | 1,253 | 1,041 | 1,138 |
| 2019 | 1,387 | 1,196 | 910 | 1,060 | 1,055 | 1,356 | 1,454 | 1,532 | 1,170 | 1,296 | 1,218 | 1,234 |
| 2020 | 1,146 | 1,051 | 1,114 | 898 | 749 | 889 | 907 | 373 | 263 | 253 | 206 | 221 |
| 2021 | 217 | 235 | 349 | 504 | 704 | 670 | 856 | 833 | 782 | 815 | 850 | 804 |
| 2022 | 914 | 870 | 900 | 950 | 829 | 697 | 1,050 | 1,107 | 1,031 | 1,085 | 1,052 | 1,004 |
| 2023 | 1,129 | 1,002 | 1,114 | 1,129 | 941 | 304 | 254 | 377 | 811 | 879 | 889 | 900 |
| 2024 | 964 | |||||||||||
| - = No Data Reported; -- = Not Applicable; NA = Not Available; W = Withheld to avoid disclosure of individual company data. |
| Release Date: 3/29/2024 |
| Next Release Date: 4/30/2024 |