|
Download Data (XLS File) |
|
||||||||
|
||||||||
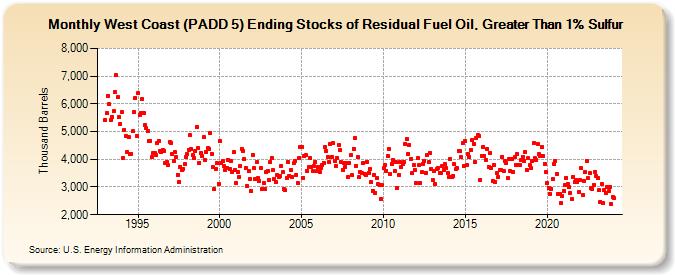
| West Coast (PADD 5) Ending Stocks of Residual Fuel Oil, Greater Than 1% Sulfur (Thousand Barrels) | ||||||||
| Year | Jan | Feb | Mar | Apr | May | Jun | Jul | Aug | Sep | Oct | Nov | Dec |
|---|---|---|---|---|---|---|---|---|---|---|---|---|
| 1993 | 5,421 | 5,665 | 6,292 | 5,980 | 5,424 | 5,520 | 5,725 | 6,438 | 7,030 | 6,244 | 5,509 | 5,268 |
| 1994 | 5,698 | 4,033 | 5,057 | 4,848 | 4,265 | 4,787 | 4,188 | 4,207 | 5,005 | 5,707 | 6,212 | 4,843 |
| 1995 | 6,374 | 5,597 | 5,685 | 6,175 | 5,662 | 5,241 | 5,115 | 5,027 | 4,647 | 4,668 | 4,070 | 4,235 |
| 1996 | 4,232 | 4,172 | 4,580 | 4,670 | 4,285 | 4,256 | 4,351 | 4,306 | 3,855 | 3,917 | 3,781 | 4,630 |
| 1997 | 4,603 | 4,177 | 3,952 | 4,251 | 4,068 | 3,444 | 3,186 | 3,739 | 3,626 | 3,659 | 3,816 | 4,088 |
| 1998 | 4,178 | 4,350 | 4,862 | 4,362 | 4,145 | 4,041 | 4,287 | 5,170 | 4,409 | 3,874 | 4,215 | 4,111 |
| 1999 | 4,800 | 3,985 | 4,247 | 4,391 | 4,378 | 4,963 | 4,202 | 3,711 | 2,923 | 3,659 | 3,851 | 3,126 |
| 2000 | 4,651 | 3,849 | 3,920 | 3,743 | 3,614 | 3,701 | 3,983 | 3,662 | 3,945 | 3,539 | 4,246 | 3,617 |
| 2001 | 3,138 | 3,539 | 3,361 | 3,764 | 4,377 | 4,315 | 4,010 | 3,679 | 3,043 | 3,561 | 3,306 | 2,852 |
| 2002 | 4,172 | 3,673 | 3,290 | 3,896 | 3,308 | 3,226 | 3,682 | 2,928 | 3,152 | 2,920 | 3,542 | 3,594 |
| 2003 | 3,265 | 3,915 | 4,050 | 3,603 | 3,284 | 3,170 | 3,432 | 3,360 | 3,386 | 3,765 | 3,525 | 2,934 |
| 2004 | 2,875 | 3,317 | 3,917 | 3,403 | 3,604 | 3,364 | 3,852 | 3,954 | 3,444 | 3,151 | 4,052 | 4,441 |
| 2005 | 4,445 | 3,335 | 4,131 | 4,137 | 3,581 | 3,707 | 4,035 | 3,717 | 3,572 | 3,758 | 3,904 | 3,570 |
| 2006 | 3,732 | 3,553 | 3,693 | 3,803 | 3,876 | 4,444 | 4,294 | 4,084 | 3,894 | 4,543 | 4,074 | 4,571 |
| 2007 | 3,941 | 3,772 | 4,059 | 4,507 | 4,333 | 3,890 | 3,630 | 3,861 | 3,725 | 3,876 | 3,378 | 3,874 |
| 2008 | 4,139 | 3,420 | 4,385 | 4,763 | 3,772 | 4,067 | 3,350 | 3,555 | 3,490 | 3,881 | 3,474 | 3,415 |
| 2009 | 3,911 | 3,517 | 3,649 | 3,180 | 2,865 | 3,447 | 2,797 | 3,324 | 3,095 | 3,070 | 2,574 | 3,062 |
| 2010 | 3,675 | 3,794 | 3,591 | 4,130 | 4,379 | 3,461 | 3,836 | 3,973 | 3,591 | 3,892 | 2,968 | 3,432 |
| 2011 | 3,917 | 3,716 | 3,822 | 3,913 | 4,558 | 4,744 | 4,207 | 4,520 | 4,007 | 3,492 | 3,788 | 3,630 |
| 2012 | 3,149 | 4,029 | 3,777 | 3,153 | 3,523 | 3,830 | 3,922 | 3,522 | 4,168 | 3,889 | 4,243 | 3,657 |
| 2013 | 3,261 | 3,565 | 3,104 | 3,650 | 3,690 | 3,521 | 3,518 | 3,751 | 3,626 | 3,816 | 3,673 | 3,492 |
| 2014 | 3,378 | 4,004 | 3,360 | 3,406 | 3,812 | 3,634 | 3,683 | 4,293 | 4,296 | 4,070 | 4,580 | 3,772 |
| 2015 | 4,646 | 3,809 | 4,184 | 4,093 | 4,346 | 4,690 | 4,560 | 3,915 | 4,773 | 4,890 | 4,838 | 3,260 |
| 2016 | 4,136 | 4,456 | 4,128 | 3,991 | 4,378 | 3,734 | 4,233 | 3,684 | 3,220 | 3,786 | 3,194 | 3,493 |
| 2017 | 3,369 | 3,611 | 3,614 | 4,100 | 3,564 | 3,922 | 3,855 | 3,315 | 4,007 | 3,576 | 4,018 | 3,557 |
| 2018 | 4,071 | 3,802 | 4,191 | 3,809 | 3,796 | 3,965 | 4,100 | 3,938 | 4,267 | 3,605 | 4,031 | 3,779 |
| 2019 | 3,682 | 3,934 | 4,582 | 4,029 | 3,980 | 4,560 | 4,177 | 4,115 | 4,456 | 4,134 | 3,845 | 3,554 |
| 2020 | 3,133 | 2,973 | 2,764 | 2,945 | 3,284 | 3,847 | 3,940 | 3,476 | 2,750 | 2,759 | 2,406 | 2,665 |
| 2021 | 2,839 | 3,056 | 3,340 | 3,124 | 2,985 | 2,797 | 2,568 | 3,370 | 3,196 | 3,246 | 3,183 | 2,826 |
| 2022 | 3,270 | 3,673 | 2,729 | 3,232 | 3,536 | 3,941 | 3,311 | 3,491 | 2,947 | 2,940 | 3,080 | 3,535 |
| 2023 | 3,389 | 3,327 | 2,886 | 2,470 | 3,116 | 2,426 | 2,903 | 2,772 | 3,003 | 2,842 | 3,011 | 2,399 |
| 2024 | 2,650 | 2,601 | ||||||||||
| - = No Data Reported; -- = Not Applicable; NA = Not Available; W = Withheld to avoid disclosure of individual company data. |
| Release Date: 4/30/2024 |
| Next Release Date: 5/31/2024 |