|
Download Data (XLS File) |
|
||||||||
|
||||||||
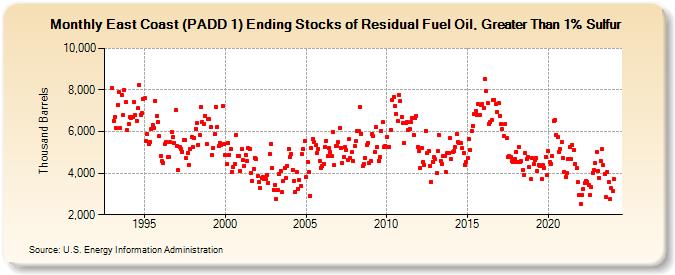
| East Coast (PADD 1) Ending Stocks of Residual Fuel Oil, Greater Than 1% Sulfur (Thousand Barrels) | ||||||||
| Year | Jan | Feb | Mar | Apr | May | Jun | Jul | Aug | Sep | Oct | Nov | Dec |
|---|---|---|---|---|---|---|---|---|---|---|---|---|
| 1993 | 8,094 | 6,531 | 6,678 | 6,153 | 7,297 | 7,884 | 6,169 | 7,742 | 6,791 | 7,996 | 7,399 | 6,069 |
| 1994 | 6,356 | 6,677 | 6,631 | 6,706 | 7,437 | 6,792 | 6,530 | 7,117 | 8,245 | 6,814 | 6,879 | 7,575 |
| 1995 | 7,592 | 5,562 | 5,875 | 5,399 | 5,499 | 6,120 | 6,309 | 6,171 | 7,483 | 6,763 | 6,440 | 5,770 |
| 1996 | 4,831 | 4,575 | 4,476 | 5,383 | 5,510 | 4,774 | 4,774 | 5,493 | 5,974 | 5,743 | 5,444 | 7,025 |
| 1997 | 5,329 | 4,161 | 5,265 | 5,154 | 5,036 | 5,586 | 5,576 | 4,717 | 4,990 | 4,403 | 5,161 | 5,734 |
| 1998 | 5,263 | 5,690 | 6,137 | 6,425 | 5,377 | 5,836 | 7,168 | 6,477 | 6,374 | 6,772 | 5,415 | 6,586 |
| 1999 | 6,607 | 6,198 | 4,896 | 5,228 | 5,870 | 7,187 | 6,233 | 5,293 | 5,472 | 5,357 | 7,227 | 5,389 |
| 2000 | 4,865 | 4,457 | 5,468 | 4,888 | 5,162 | 4,064 | 4,317 | 4,463 | 5,845 | 4,846 | 4,829 | 4,108 |
| 2001 | 5,158 | 4,614 | 4,354 | 4,873 | 4,593 | 5,199 | 5,153 | 4,019 | 3,624 | 4,218 | 4,744 | 4,675 |
| 2002 | 3,866 | 3,562 | 3,289 | 3,762 | 3,826 | 3,695 | 3,710 | 3,899 | 3,533 | 4,943 | 5,415 | 4,247 |
| 2003 | 3,208 | 3,421 | 2,741 | 3,205 | 3,967 | 4,116 | 3,074 | 3,608 | 4,253 | 3,786 | 4,346 | 5,174 |
| 2004 | 4,779 | 4,932 | 4,170 | 3,621 | 3,101 | 4,068 | 3,238 | 3,685 | 3,374 | 4,907 | 5,150 | 5,539 |
| 2005 | 3,822 | 4,545 | 4,041 | 2,919 | 5,203 | 5,647 | 5,485 | 5,350 | 4,972 | 5,176 | 4,575 | 4,260 |
| 2006 | 4,343 | 4,448 | 5,275 | 5,553 | 4,809 | 5,197 | 5,006 | 4,822 | 5,968 | 4,371 | 5,301 | 5,301 |
| 2007 | 5,478 | 6,163 | 5,221 | 4,501 | 4,767 | 5,252 | 5,112 | 4,646 | 5,628 | 4,742 | 4,997 | 4,560 |
| 2008 | 5,296 | 5,529 | 6,016 | 6,041 | 7,158 | 5,901 | 4,322 | 4,449 | 4,746 | 5,337 | 5,460 | 4,490 |
| 2009 | 4,596 | 5,881 | 5,772 | 5,000 | 6,205 | 5,249 | 4,598 | 4,761 | 6,034 | 6,443 | 5,266 | 5,317 |
| 2010 | 5,747 | 5,279 | 5,267 | 6,094 | 7,503 | 7,659 | 7,208 | 6,826 | 6,497 | 7,760 | 7,454 | 6,706 |
| 2011 | 6,391 | 5,456 | 6,392 | 6,482 | 6,086 | 6,116 | 6,465 | 6,660 | 5,847 | 6,661 | 6,760 | 5,272 |
| 2012 | 5,045 | 4,246 | 5,191 | 4,530 | 4,393 | 6,050 | 4,970 | 5,054 | 4,364 | 3,582 | 4,547 | 4,765 |
| 2013 | 4,666 | 3,994 | 5,049 | 5,838 | 4,604 | 4,446 | 4,827 | 4,843 | 4,041 | 4,976 | 4,991 | 5,681 |
| 2014 | 4,659 | 5,036 | 5,068 | 5,238 | 5,891 | 5,515 | 5,427 | 5,465 | 5,191 | 4,992 | 4,411 | 4,520 |
| 2015 | 4,719 | 5,625 | 5,124 | 6,034 | 6,286 | 6,837 | 6,972 | 6,776 | 7,307 | 6,813 | 7,254 | 7,305 |
| 2016 | 7,154 | 8,515 | 7,945 | 7,364 | 6,343 | 6,454 | 6,533 | 7,524 | 7,536 | 7,322 | 6,941 | 7,355 |
| 2017 | 6,759 | 6,353 | 6,100 | 5,779 | 6,363 | 5,689 | 4,755 | 4,823 | 4,786 | 4,563 | 4,524 | 4,688 |
| 2018 | 5,016 | 4,559 | 5,278 | 4,530 | 4,567 | 4,148 | 3,890 | 4,968 | 4,670 | 4,774 | 4,275 | 3,703 |
| 2019 | 4,721 | 4,446 | 4,646 | 4,717 | 4,112 | 4,386 | 4,338 | 3,714 | 4,368 | 4,256 | 4,791 | 3,907 |
| 2020 | 5,067 | 4,520 | 4,432 | 4,843 | 6,510 | 6,574 | 5,853 | 5,758 | 5,030 | 5,145 | 5,493 | 4,737 |
| 2021 | 4,069 | 3,801 | 4,006 | 4,679 | 5,252 | 4,658 | 5,377 | 5,105 | 4,423 | 4,248 | 3,554 | 2,941 |
| 2022 | 2,531 | 2,956 | 3,242 | 3,515 | 3,630 | 3,594 | 3,406 | 2,953 | 3,316 | 4,022 | 4,143 | 4,476 |
| 2023 | 5,036 | 4,117 | 3,786 | 4,598 | 5,143 | 4,377 | 3,978 | 2,839 | 4,067 | 3,569 | 2,743 | 3,269 |
| 2024 | 3,137 | |||||||||||
| - = No Data Reported; -- = Not Applicable; NA = Not Available; W = Withheld to avoid disclosure of individual company data. |
| Release Date: 3/29/2024 |
| Next Release Date: 4/30/2024 |