|
Download Data (XLS File) |
|
||||||||
|
||||||||
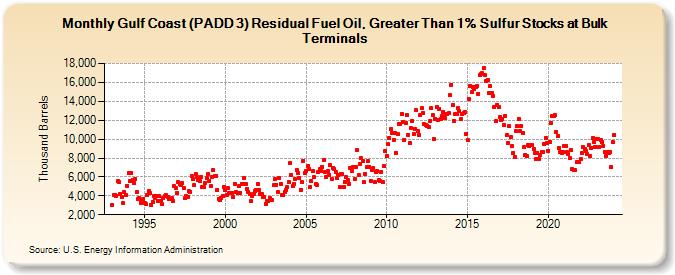
| Gulf Coast (PADD 3) Residual Fuel Oil, Greater Than 1% Sulfur Stocks at Bulk Terminals (Thousand Barrels) | ||||||||
| Year | Jan | Feb | Mar | Apr | May | Jun | Jul | Aug | Sep | Oct | Nov | Dec |
|---|---|---|---|---|---|---|---|---|---|---|---|---|
| 1993 | 3,062 | 4,093 | 4,138 | 4,014 | 5,517 | 5,440 | 4,196 | 3,844 | 3,231 | 4,365 | 4,127 | 5,065 |
| 1994 | 6,395 | 5,555 | 6,362 | 5,680 | 5,397 | 5,763 | 4,375 | 3,610 | 3,775 | 3,271 | 3,543 | 3,637 |
| 1995 | 3,266 | 3,155 | 4,111 | 4,480 | 4,261 | 2,976 | 3,380 | 4,002 | 3,755 | 4,003 | 3,422 | 3,949 |
| 1996 | 3,480 | 3,088 | 3,785 | 3,963 | 4,059 | 3,908 | 3,687 | 3,655 | 3,739 | 3,435 | 5,035 | 4,793 |
| 1997 | 4,307 | 5,431 | 5,212 | 5,095 | 5,320 | 4,808 | 3,736 | 3,950 | 3,878 | 4,479 | 4,434 | 6,059 |
| 1998 | 5,735 | 5,137 | 6,315 | 5,974 | 5,640 | 5,571 | 5,969 | 4,909 | 4,970 | 5,333 | 5,893 | 6,268 |
| 1999 | 5,606 | 5,006 | 5,990 | 6,727 | 6,106 | 6,094 | 4,652 | 3,707 | 3,525 | 3,795 | 4,022 | 4,944 |
| 2000 | 4,585 | 4,088 | 4,798 | 4,284 | 4,308 | 4,326 | 3,892 | 5,301 | 4,358 | 4,296 | 5,007 | 4,322 |
| 2001 | 5,296 | 5,241 | 5,860 | 5,226 | 4,760 | 4,434 | 4,218 | 3,452 | 3,937 | 4,225 | 4,473 | 4,613 |
| 2002 | 5,293 | 4,660 | 4,165 | 4,169 | 3,907 | 3,851 | 3,168 | 3,434 | 3,494 | 3,774 | 3,548 | 3,571 |
| 2003 | 5,098 | 5,795 | 5,185 | 4,365 | 5,872 | 5,301 | 4,105 | 4,134 | 4,412 | 4,562 | 4,888 | 5,462 |
| 2004 | 7,460 | 6,246 | 5,046 | 5,275 | 5,778 | 6,744 | 6,450 | 5,879 | 4,631 | 5,456 | 7,710 | 6,402 |
| 2005 | 6,626 | 7,147 | 6,819 | 4,923 | 5,547 | 6,619 | 5,938 | 5,225 | 5,170 | 6,482 | 6,784 | 6,614 |
| 2006 | 7,085 | 7,777 | 6,534 | 6,018 | 6,587 | 6,210 | 7,240 | 5,803 | 6,959 | 6,848 | 6,551 | 5,832 |
| 2007 | 6,158 | 4,920 | 6,340 | 6,267 | 4,906 | 5,509 | 5,975 | 5,635 | 5,262 | 6,968 | 6,675 | 7,044 |
| 2008 | 5,742 | 7,069 | 8,818 | 6,163 | 7,417 | 7,955 | 7,631 | 5,434 | 6,323 | 7,051 | 7,681 | 7,075 |
| 2009 | 5,604 | 6,755 | 6,934 | 5,450 | 6,517 | 6,601 | 5,646 | 5,600 | 6,567 | 5,420 | 7,110 | 8,728 |
| 2010 | 8,186 | 9,429 | 10,138 | 11,020 | 10,652 | 9,951 | 10,603 | 8,580 | 10,513 | 11,579 | 11,565 | 12,672 |
| 2011 | 11,770 | 9,938 | 11,686 | 12,517 | 10,467 | 9,535 | 11,149 | 11,898 | 10,524 | 11,081 | 13,062 | 10,869 |
| 2012 | 10,479 | 12,545 | 13,280 | 12,808 | 11,554 | 11,490 | 11,434 | 11,267 | 11,907 | 13,256 | 12,601 | 10,022 |
| 2013 | 12,158 | 13,371 | 12,016 | 13,232 | 12,105 | 12,441 | 12,847 | 12,220 | 12,655 | 12,683 | 12,730 | 14,624 |
| 2014 | 15,770 | 13,609 | 11,943 | 12,626 | 12,650 | 13,246 | 12,947 | 12,127 | 12,684 | 12,774 | 12,815 | 10,579 |
| 2015 | 9,955 | 14,255 | 15,641 | 14,960 | 15,548 | 15,342 | 15,552 | 15,621 | 14,810 | 16,753 | 16,876 | 16,966 |
| 2016 | 17,513 | 16,763 | 16,098 | 16,259 | 14,906 | 15,630 | 14,921 | 14,557 | 13,416 | 11,912 | 13,660 | 13,395 |
| 2017 | 12,334 | 12,073 | 12,097 | 11,529 | 12,470 | 10,429 | 9,637 | 11,333 | 10,175 | 9,244 | 8,541 | 8,113 |
| 2018 | 10,811 | 11,351 | 12,165 | 10,830 | 11,426 | 10,685 | 9,188 | 8,348 | 8,261 | 9,365 | 9,218 | 9,327 |
| 2019 | 9,359 | 8,950 | 8,539 | 7,862 | 8,542 | 7,947 | 8,310 | 8,629 | 8,672 | 9,439 | 10,137 | 9,558 |
| 2020 | 8,770 | 9,684 | 11,744 | 12,492 | 12,426 | 12,503 | 10,762 | 10,310 | 9,045 | 8,684 | 8,546 | 8,630 |
| 2021 | 9,234 | 9,258 | 8,589 | 8,375 | 7,977 | 8,828 | 6,788 | 6,709 | 6,692 | 7,554 | 7,530 | 7,552 |
| 2022 | 7,873 | 8,537 | 9,175 | 8,927 | 8,731 | 8,396 | 9,382 | 8,176 | 9,097 | 10,128 | 9,678 | 9,214 |
| 2023 | 10,026 | 10,062 | 9,214 | 9,907 | 9,678 | 9,306 | 8,651 | 8,224 | 8,662 | 8,538 | 8,643 | 7,058 |
| 2024 | 9,650 | |||||||||||
| - = No Data Reported; -- = Not Applicable; NA = Not Available; W = Withheld to avoid disclosure of individual company data. |
| Release Date: 3/29/2024 |
| Next Release Date: 4/30/2024 |