|
Download Data (XLS File) |
|
||||||||
|
||||||||
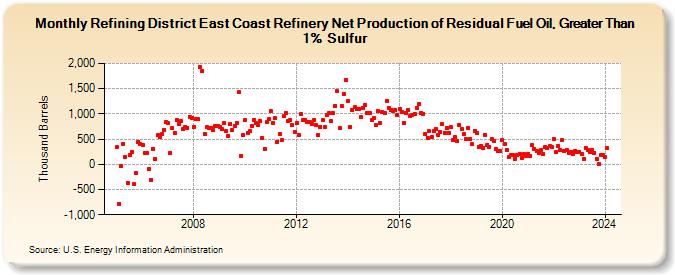
| Refining District East Coast Refinery Net Production of Residual Fuel Oil, Greater Than 1% Sulfur (Thousand Barrels) | ||||||||
| Year | Jan | Feb | Mar | Apr | May | Jun | Jul | Aug | Sep | Oct | Nov | Dec |
|---|---|---|---|---|---|---|---|---|---|---|---|---|
| 2005 | 340 | -781 | -32 | 409 | 143 | -376 | 178 | 242 | -393 | -168 | 451 | 403 |
| 2006 | 388 | 225 | 217 | -94 | -314 | 311 | 108 | 573 | 545 | 593 | 682 | 835 |
| 2007 | 814 | 229 | 713 | 619 | 882 | 801 | 851 | 695 | 745 | 729 | 948 | 923 |
| 2008 | 741 | 893 | 890 | 1,930 | 1,850 | 603 | 736 | 724 | 724 | 674 | 768 | 756 |
| 2009 | 741 | 691 | 820 | 658 | 567 | 807 | 684 | 761 | 820 | 1,428 | 174 | 572 |
| 2010 | 873 | 630 | 655 | 766 | 885 | 814 | 778 | 859 | 521 | 307 | 833 | 889 |
| 2011 | 1,050 | 816 | 918 | 450 | 606 | 474 | 967 | 1,014 | 865 | 879 | 776 | 637 |
| 2012 | 820 | 574 | 997 | 873 | 880 | 849 | 835 | 805 | 881 | 775 | 580 | 745 |
| 2013 | 876 | 740 | 986 | 1,011 | 850 | 1,021 | 1,161 | 1,449 | 713 | 1,153 | 1,398 | 1,679 |
| 2014 | 1,257 | 744 | 1,069 | 1,130 | 1,091 | 1,101 | 931 | 1,121 | 1,171 | 1,015 | 1,010 | 875 |
| 2015 | 914 | 782 | 1,055 | 825 | 1,039 | 1,014 | 1,251 | 1,112 | 1,083 | 1,056 | 1,082 | 984 |
| 2016 | 1,094 | 1,033 | 823 | 1,021 | 1,084 | 963 | 969 | 1,005 | 1,119 | 1,201 | 1,017 | 1,002 |
| 2017 | 594 | 531 | 655 | 545 | 655 | 703 | 579 | 646 | 794 | 630 | 716 | 630 |
| 2018 | 732 | 481 | 532 | 459 | 776 | 696 | 597 | 495 | 718 | 503 | 402 | 661 |
| 2019 | 625 | 350 | 369 | 326 | 585 | 390 | 342 | 503 | 458 | 299 | 266 | 273 |
| 2020 | 476 | 403 | 290 | 143 | 176 | 189 | 112 | 184 | 203 | 131 | 196 | 160 |
| 2021 | 214 | 171 | 378 | 301 | 260 | 231 | 283 | 214 | 347 | 323 | 356 | 346 |
| 2022 | 496 | 236 | 366 | 277 | 475 | 273 | 292 | 225 | 248 | 203 | 266 | 249 |
| 2023 | 251 | 211 | 106 | 327 | 277 | 244 | 290 | 232 | 112 | 1 | 177 | 185 |
| 2024 | 137 | |||||||||||
| - = No Data Reported; -- = Not Applicable; NA = Not Available; W = Withheld to avoid disclosure of individual company data. |
| Release Date: 3/29/2024 |
| Next Release Date: 4/30/2024 |