|
Download Data (XLS File) |
|
||||||||
|
||||||||
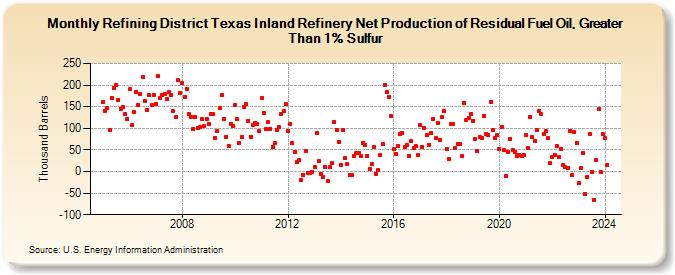
| Refining District Texas Inland Refinery Net Production of Residual Fuel Oil, Greater Than 1% Sulfur (Thousand Barrels) | ||||||||
| Year | Jan | Feb | Mar | Apr | May | Jun | Jul | Aug | Sep | Oct | Nov | Dec |
|---|---|---|---|---|---|---|---|---|---|---|---|---|
| 2005 | 160 | 140 | 148 | 95 | 171 | 194 | 201 | 165 | 145 | 149 | 133 | 121 |
| 2006 | 190 | 108 | 137 | 185 | 154 | 180 | 218 | 164 | 142 | 176 | 153 | 178 |
| 2007 | 157 | 220 | 170 | 177 | 180 | 167 | 184 | 178 | 140 | 125 | 211 | 181 |
| 2008 | 204 | 173 | 191 | 132 | 127 | 98 | 126 | 101 | 103 | 121 | 106 | 122 |
| 2009 | 110 | 134 | 134 | 78 | 93 | 146 | 178 | 122 | 80 | 60 | 110 | 105 |
| 2010 | 153 | 121 | 67 | 79 | 149 | 156 | 118 | 81 | 108 | 113 | 109 | 93 |
| 2011 | 169 | 135 | 98 | 114 | 99 | 57 | 66 | 97 | 102 | 133 | 139 | 156 |
| 2012 | 94 | 109 | 66 | 45 | 21 | 27 | -19 | -8 | 48 | -4 | -4 | 0 |
| 2013 | 10 | 89 | 24 | -6 | -13 | 11 | -21 | 10 | 19 | 115 | 97 | 69 |
| 2014 | 16 | 96 | 31 | 18 | -9 | -8 | 37 | 42 | 42 | 36 | 67 | 62 |
| 2015 | 36 | 6 | 18 | 57 | -5 | 3 | 39 | 63 | 200 | 183 | 173 | 128 |
| 2016 | 51 | 41 | 58 | 87 | 89 | 57 | 62 | 37 | 70 | 55 | 60 | 38 |
| 2017 | 107 | 57 | 101 | 84 | 62 | 88 | 121 | 77 | 113 | 74 | 126 | 139 |
| 2018 | 51 | 29 | 110 | 109 | 54 | 64 | 63 | 36 | 158 | 120 | 123 | 132 |
| 2019 | 118 | 76 | 47 | 79 | 77 | 129 | 87 | 84 | 162 | 97 | 77 | 85 |
| 2020 | 52 | 102 | 49 | -11 | 46 | 76 | 50 | 45 | 37 | 38 | 36 | 38 |
| 2021 | 85 | 54 | 127 | 79 | 71 | 96 | 141 | 133 | 87 | 93 | 77 | 19 |
| 2022 | 34 | 39 | 59 | 33 | 52 | 16 | 10 | 9 | 94 | -7 | 92 | 66 |
| 2023 | -26 | 8 | 42 | -52 | -12 | 86 | 0 | -65 | 26 | 144 | 0 | 86 |
| 2024 | 78 | |||||||||||
| - = No Data Reported; -- = Not Applicable; NA = Not Available; W = Withheld to avoid disclosure of individual company data. |
| Release Date: 3/29/2024 |
| Next Release Date: 4/30/2024 |