|
Download Data (XLS File) |
|
||||||||
|
||||||||
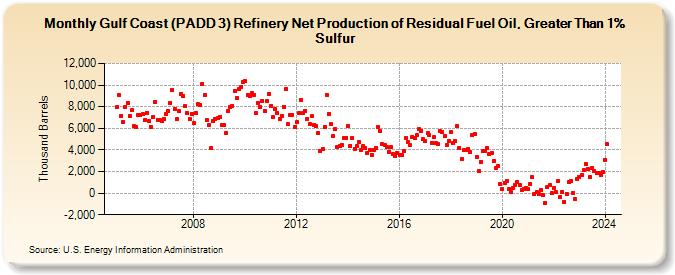
| Gulf Coast (PADD 3) Refinery Net Production of Residual Fuel Oil, Greater Than 1% Sulfur (Thousand Barrels) | ||||||||
| Year | Jan | Feb | Mar | Apr | May | Jun | Jul | Aug | Sep | Oct | Nov | Dec |
|---|---|---|---|---|---|---|---|---|---|---|---|---|
| 2005 | 7,971 | 9,047 | 7,122 | 6,626 | 7,997 | 8,355 | 7,132 | 7,670 | 6,178 | 6,131 | 7,259 | 7,277 |
| 2006 | 7,346 | 6,731 | 7,446 | 6,662 | 6,151 | 7,087 | 8,418 | 6,795 | 6,761 | 6,672 | 6,848 | 7,363 |
| 2007 | 7,587 | 8,378 | 9,563 | 7,763 | 6,880 | 7,589 | 9,192 | 8,987 | 8,024 | 7,396 | 6,825 | 7,328 |
| 2008 | 6,460 | 7,440 | 8,210 | 8,154 | 10,141 | 9,109 | 6,765 | 6,275 | 4,190 | 6,711 | 6,825 | 6,922 |
| 2009 | 7,051 | 6,303 | 6,304 | 5,579 | 7,603 | 7,971 | 8,102 | 9,485 | 8,804 | 9,604 | 9,805 | 10,267 |
| 2010 | 10,332 | 9,095 | 8,949 | 9,224 | 9,097 | 7,436 | 8,359 | 7,942 | 8,564 | 7,587 | 8,516 | 9,190 |
| 2011 | 8,078 | 7,001 | 7,819 | 7,416 | 6,897 | 7,143 | 7,998 | 9,641 | 6,355 | 7,220 | 7,240 | 6,120 |
| 2012 | 6,562 | 7,382 | 8,661 | 7,385 | 7,623 | 6,877 | 6,373 | 7,114 | 6,329 | 6,191 | 5,604 | 3,931 |
| 2013 | 4,038 | 6,159 | 9,126 | 7,357 | 6,388 | 5,332 | 5,945 | 4,272 | 4,316 | 4,481 | 5,107 | 5,138 |
| 2014 | 6,227 | 4,407 | 5,111 | 4,120 | 4,329 | 4,751 | 3,998 | 4,337 | 4,179 | 3,708 | 3,977 | 3,562 |
| 2015 | 4,033 | 4,189 | 6,122 | 5,711 | 4,509 | 4,498 | 4,234 | 3,790 | 4,266 | 3,581 | 3,414 | 3,709 |
| 2016 | 3,484 | 3,524 | 3,855 | 5,106 | 4,711 | 4,408 | 5,208 | 5,080 | 5,348 | 5,906 | 5,778 | 4,979 |
| 2017 | 4,791 | 5,559 | 5,395 | 4,664 | 5,159 | 4,660 | 4,542 | 5,732 | 5,641 | 5,251 | 4,459 | 4,812 |
| 2018 | 5,631 | 4,656 | 4,841 | 6,176 | 4,212 | 3,164 | 3,991 | 4,005 | 4,044 | 3,819 | 5,339 | 5,515 |
| 2019 | 3,382 | 2,008 | 2,912 | 3,915 | 3,900 | 4,212 | 3,666 | 3,719 | 2,998 | 2,355 | 2,471 | 828 |
| 2020 | 337 | 966 | 1,110 | 344 | 79 | 441 | 752 | 1,066 | 790 | 277 | 373 | 458 |
| 2021 | 380 | 840 | 1,485 | -112 | 61 | -120 | 310 | -207 | -882 | 574 | 706 | 0 |
| 2022 | 481 | 96 | 1,108 | -387 | 125 | -779 | -57 | 994 | 1,103 | 24 | -564 | 1,260 |
| 2023 | 1,530 | 1,671 | 2,108 | 2,701 | 2,214 | 1,520 | 2,328 | 2,009 | 1,849 | 1,868 | 1,696 | 1,993 |
| 2024 | 3,086 | |||||||||||
| - = No Data Reported; -- = Not Applicable; NA = Not Available; W = Withheld to avoid disclosure of individual company data. |
| Release Date: 3/29/2024 |
| Next Release Date: 4/30/2024 |