|
Download Data (XLS File) |
|
||||||||
|
||||||||
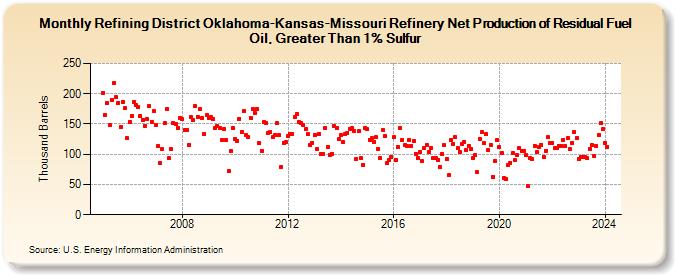
| Refining District Oklahoma-Kansas-Missouri Refinery Net Production of Residual Fuel Oil, Greater Than 1% Sulfur (Thousand Barrels) | ||||||||
| Year | Jan | Feb | Mar | Apr | May | Jun | Jul | Aug | Sep | Oct | Nov | Dec |
|---|---|---|---|---|---|---|---|---|---|---|---|---|
| 2005 | 201 | 165 | 185 | 148 | 190 | 218 | 194 | 185 | 145 | 187 | 176 | 126 |
| 2006 | 153 | 163 | 186 | 181 | 178 | 163 | 157 | 147 | 159 | 180 | 154 | 171 |
| 2007 | 148 | 114 | 85 | 108 | 151 | 174 | 93 | 108 | 152 | 150 | 144 | 160 |
| 2008 | 158 | 140 | 140 | 116 | 161 | 156 | 179 | 162 | 174 | 160 | 134 | 165 |
| 2009 | 160 | 161 | 158 | 144 | 147 | 143 | 124 | 142 | 124 | 72 | 105 | 143 |
| 2010 | 125 | 122 | 159 | 137 | 171 | 131 | 128 | 160 | 175 | 168 | 174 | 118 |
| 2011 | 106 | 153 | 152 | 135 | 137 | 128 | 131 | 151 | 131 | 79 | 119 | 120 |
| 2012 | 130 | 134 | 134 | 161 | 167 | 153 | 151 | 148 | 141 | 133 | 115 | 119 |
| 2013 | 131 | 109 | 134 | 101 | 100 | 143 | 112 | 99 | 101 | 147 | 143 | 125 |
| 2014 | 131 | 120 | 133 | 135 | 142 | 143 | 138 | 92 | 138 | 94 | 83 | 144 |
| 2015 | 141 | 124 | 126 | 121 | 128 | 109 | 94 | 140 | 130 | 86 | 91 | 95 |
| 2016 | 128 | 91 | 112 | 143 | 124 | 115 | 114 | 124 | 114 | 122 | 101 | 94 |
| 2017 | 104 | 88 | 110 | 115 | 104 | 110 | 93 | 94 | 91 | 79 | 101 | 115 |
| 2018 | 92 | 65 | 124 | 117 | 128 | 110 | 104 | 117 | 121 | 107 | 114 | 108 |
| 2019 | 94 | 99 | 70 | 125 | 137 | 118 | 133 | 107 | 115 | 63 | 89 | 124 |
| 2020 | 112 | 102 | 60 | 59 | 82 | 86 | 102 | 90 | 98 | 110 | 106 | 105 |
| 2021 | 99 | 47 | 93 | 92 | 114 | 103 | 112 | 116 | 96 | 106 | 128 | 119 |
| 2022 | 118 | 110 | 110 | 114 | 114 | 124 | 113 | 126 | 108 | 119 | 136 | 127 |
| 2023 | 92 | 96 | 95 | 95 | 93 | 109 | 115 | 97 | 114 | 132 | 151 | 141 |
| 2024 | 119 | |||||||||||
| - = No Data Reported; -- = Not Applicable; NA = Not Available; W = Withheld to avoid disclosure of individual company data. |
| Release Date: 3/29/2024 |
| Next Release Date: 4/30/2024 |