|
Download Data (XLS File) |
|
||||||||
|
||||||||
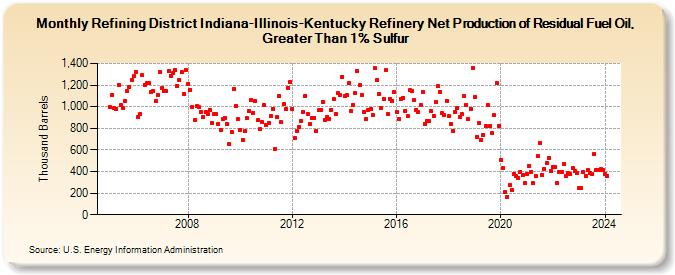
| Refining District Indiana-Illinois-Kentucky Refinery Net Production of Residual Fuel Oil, Greater Than 1% Sulfur (Thousand Barrels) | ||||||||
| Year | Jan | Feb | Mar | Apr | May | Jun | Jul | Aug | Sep | Oct | Nov | Dec |
|---|---|---|---|---|---|---|---|---|---|---|---|---|
| 2005 | 995 | 1,111 | 984 | 980 | 1,200 | 1,015 | 985 | 1,057 | 1,143 | 1,185 | 1,251 | 1,281 |
| 2006 | 1,322 | 907 | 932 | 1,289 | 1,202 | 1,215 | 1,221 | 1,136 | 1,144 | 1,057 | 1,109 | 1,320 |
| 2007 | 1,174 | 1,148 | 1,144 | 1,328 | 1,287 | 1,309 | 1,336 | 1,195 | 1,249 | 1,318 | 1,119 | 1,342 |
| 2008 | 1,214 | 1,159 | 996 | 874 | 1,003 | 994 | 954 | 908 | 955 | 929 | 972 | 853 |
| 2009 | 935 | 930 | 840 | 781 | 883 | 899 | 844 | 650 | 768 | 1,167 | 1,009 | 882 |
| 2010 | 788 | 693 | 771 | 894 | 959 | 1,062 | 946 | 1,052 | 874 | 790 | 859 | 1,015 |
| 2011 | 829 | 853 | 910 | 981 | 606 | 901 | 1,096 | 855 | 1,024 | 980 | 1,176 | 1,229 |
| 2012 | 975 | 708 | 779 | 811 | 870 | 954 | 1,103 | 935 | 837 | 893 | 897 | 774 |
| 2013 | 967 | 967 | 1,046 | 878 | 903 | 888 | 973 | 1,070 | 935 | 1,124 | 1,105 | 1,276 |
| 2014 | 1,097 | 1,105 | 1,219 | 958 | 1,018 | 1,125 | 1,332 | 1,200 | 1,107 | 952 | 886 | 970 |
| 2015 | 978 | 924 | 1,354 | 1,243 | 1,118 | 992 | 1,071 | 1,337 | 933 | 1,074 | 1,055 | 1,140 |
| 2016 | 952 | 888 | 1,072 | 1,084 | 964 | 915 | 1,151 | 1,143 | 1,063 | 970 | 951 | 1,015 |
| 2017 | 1,137 | 843 | 863 | 866 | 960 | 917 | 1,046 | 1,191 | 1,136 | 941 | 925 | 1,052 |
| 2018 | 912 | 841 | 778 | 955 | 984 | 904 | 928 | 1,096 | 1,019 | 883 | 979 | 1,359 |
| 2019 | 1,087 | 722 | 848 | 692 | 735 | 817 | 1,019 | 819 | 755 | 922 | 1,216 | 822 |
| 2020 | 503 | 435 | 213 | 164 | 273 | 230 | 379 | 358 | 343 | 397 | 370 | 292 |
| 2021 | 380 | 454 | 396 | 293 | 359 | 539 | 664 | 371 | 424 | 478 | 525 | 407 |
| 2022 | 444 | 438 | 289 | 393 | 395 | 473 | 357 | 386 | 379 | 432 | 409 | 390 |
| 2023 | 251 | 243 | 393 | 362 | 410 | 384 | 378 | 564 | 414 | 410 | 425 | 415 |
| 2024 | 374 | |||||||||||
| - = No Data Reported; -- = Not Applicable; NA = Not Available; W = Withheld to avoid disclosure of individual company data. |
| Release Date: 3/29/2024 |
| Next Release Date: 4/30/2024 |