|
Download Data (XLS File) |
|
||||||||
|
||||||||
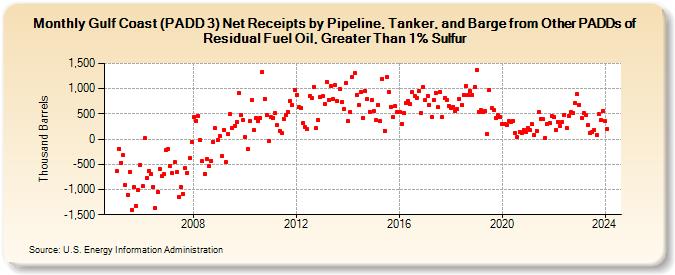
| Gulf Coast (PADD 3) Net Receipts by Pipeline, Tanker, and Barge from Other PADDs of Residual Fuel Oil, Greater Than 1% Sulfur (Thousand Barrels) | ||||||||
| Year | Jan | Feb | Mar | Apr | May | Jun | Jul | Aug | Sep | Oct | Nov | Dec |
|---|---|---|---|---|---|---|---|---|---|---|---|---|
| 2005 | -642 | -189 | -469 | -324 | -912 | -1,106 | -645 | -1,400 | -954 | -1,318 | -1,008 | -511 |
| 2006 | -940 | 15 | -763 | -624 | -699 | -945 | -1,362 | -1,057 | -591 | -734 | -694 | -217 |
| 2007 | -189 | -531 | -681 | -462 | -653 | -1,141 | -960 | -1,086 | -582 | -666 | -380 | -51 |
| 2008 | 436 | 364 | 465 | -21 | -442 | -689 | -399 | -541 | -431 | -56 | 214 | -18 |
| 2009 | 58 | -345 | 187 | -454 | 106 | 489 | 220 | 262 | 344 | 908 | 483 | 370 |
| 2010 | 35 | -205 | 351 | 769 | 186 | 419 | 363 | 420 | 1,332 | 803 | 474 | -36 |
| 2011 | 431 | 428 | 508 | 273 | 163 | 122 | 400 | 474 | 540 | 757 | 673 | 982 |
| 2012 | 879 | 629 | 619 | 320 | 231 | 196 | 857 | 806 | 1,042 | 214 | 387 | 833 |
| 2013 | 848 | 705 | 1,138 | 779 | 1,047 | 786 | 1,065 | 746 | 989 | 735 | 601 | 1,116 |
| 2014 | 355 | 533 | 1,228 | 1,308 | 880 | 676 | 937 | 409 | 954 | 788 | 546 | 776 |
| 2015 | 551 | 373 | 686 | 350 | 1,200 | 162 | 1,227 | 944 | 644 | 429 | 651 | 531 |
| 2016 | 540 | 305 | 520 | 719 | 758 | 695 | 928 | 859 | 819 | 946 | 512 | 1,038 |
| 2017 | 775 | 864 | 672 | 446 | 773 | 914 | 629 | 935 | 432 | 824 | 777 | 659 |
| 2018 | 610 | 628 | 557 | 593 | 798 | 673 | 874 | 1,052 | 865 | 948 | 878 | 1,035 |
| 2019 | 1,365 | 538 | 572 | 538 | 549 | 110 | 973 | 615 | 574 | 424 | 479 | 431 |
| 2020 | 293 | 290 | 272 | 360 | 341 | 363 | 118 | 35 | 139 | 114 | 188 | 138 |
| 2021 | 217 | 173 | 292 | 79 | 161 | 529 | 398 | 397 | 24 | 300 | 319 | 460 |
| 2022 | 440 | 189 | 345 | 262 | 343 | 484 | 228 | 465 | 534 | 527 | 709 | 888 |
| 2023 | 673 | 421 | 513 | 481 | 279 | 127 | 137 | 179 | 86 | 488 | 375 | 557 |
| 2024 | 352 | 203 | ||||||||||
| - = No Data Reported; -- = Not Applicable; NA = Not Available; W = Withheld to avoid disclosure of individual company data. |
| Release Date: 4/30/2024 |
| Next Release Date: 5/31/2024 |