|
Download Data (XLS File) |
|
||||||||
|
||||||||
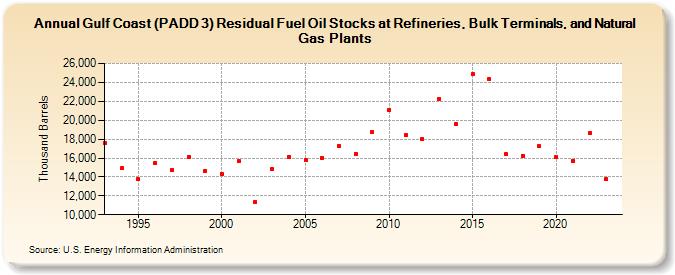
| Gulf Coast (PADD 3) Residual Fuel Oil Stocks at Refineries, Bulk Terminals, and Natural Gas Plants (Thousand Barrels) | ||||||||
| Decade | Year-0 | Year-1 | Year-2 | Year-3 | Year-4 | Year-5 | Year-6 | Year-7 | Year-8 | Year-9 |
|---|---|---|---|---|---|---|---|---|---|---|
| 1990's | 17,610 | 14,906 | 13,736 | 15,493 | 14,745 | 16,085 | 14,663 | |||
| 2000's | 14,311 | 15,647 | 11,370 | 14,862 | 16,156 | 15,742 | 16,037 | 17,276 | 16,442 | 18,719 |
| 2010's | 21,078 | 18,432 | 18,032 | 22,284 | 19,597 | 24,866 | 24,356 | 16,374 | 16,251 | 17,225 |
| 2020's | 16,106 | 15,710 | 18,640 | 13,775 |
| - = No Data Reported; -- = Not Applicable; NA = Not Available; W = Withheld to avoid disclosure of individual company data. |
| Release Date: 4/30/2024 |
| Next Release Date: 8/30/2024 |