|
Download Data (XLS File) |
|
||||||||
|
||||||||
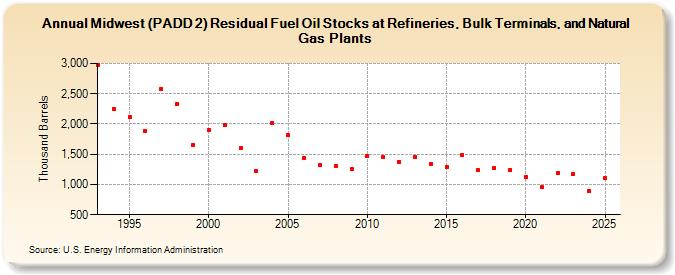
| Midwest (PADD 2) Residual Fuel Oil Stocks at Refineries, Bulk Terminals, and Natural Gas Plants (Thousand Barrels) | ||||||||
| Decade | Year-0 | Year-1 | Year-2 | Year-3 | Year-4 | Year-5 | Year-6 | Year-7 | Year-8 | Year-9 |
|---|---|---|---|---|---|---|---|---|---|---|
| 1990's | 2,979 | 2,249 | 2,108 | 1,891 | 2,585 | 2,335 | 1,660 | |||
| 2000's | 1,903 | 1,991 | 1,596 | 1,216 | 2,017 | 1,814 | 1,444 | 1,316 | 1,307 | 1,255 |
| 2010's | 1,477 | 1,448 | 1,377 | 1,452 | 1,346 | 1,293 | 1,489 | 1,234 | 1,280 | 1,247 |
| 2020's | 1,129 | 957 | 1,188 | 1,214 |
| - = No Data Reported; -- = Not Applicable; NA = Not Available; W = Withheld to avoid disclosure of individual company data. |
| Release Date: 3/29/2024 |
| Next Release Date: 8/30/2024 |