|
Download Data (XLS File) |
|
||||||||
|
||||||||
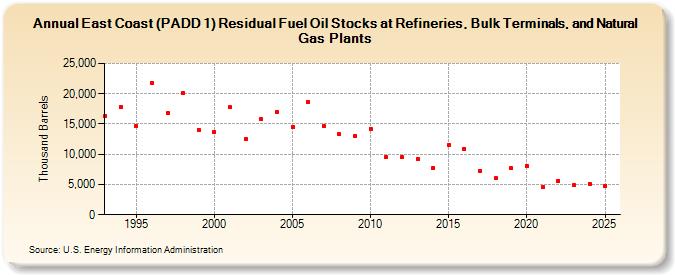
| East Coast (PADD 1) Residual Fuel Oil Stocks at Refineries, Bulk Terminals, and Natural Gas Plants (Thousand Barrels) | ||||||||
| Decade | Year-0 | Year-1 | Year-2 | Year-3 | Year-4 | Year-5 | Year-6 | Year-7 | Year-8 | Year-9 |
|---|---|---|---|---|---|---|---|---|---|---|
| 1990's | 16,288 | 17,788 | 14,665 | 21,780 | 16,747 | 20,062 | 14,066 | |||
| 2000's | 13,660 | 17,757 | 12,527 | 15,780 | 17,020 | 14,514 | 18,667 | 14,673 | 13,261 | 13,003 |
| 2010's | 14,175 | 9,563 | 9,532 | 9,227 | 7,723 | 11,597 | 10,924 | 7,304 | 6,033 | 7,671 |
| 2020's | 8,014 | 4,541 | 5,611 | 4,859 |
| - = No Data Reported; -- = Not Applicable; NA = Not Available; W = Withheld to avoid disclosure of individual company data. |
| Release Date: 3/29/2024 |
| Next Release Date: 8/30/2024 |