|
Download Data (XLS File) |
|
||||||||
|
||||||||
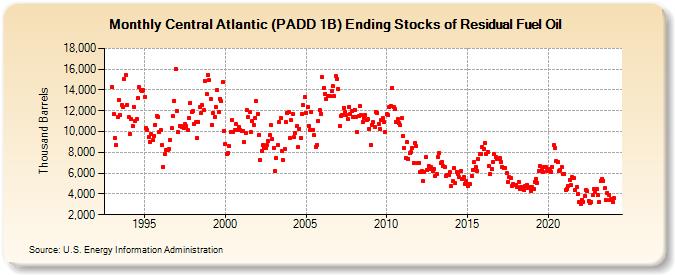
| Central Atlantic (PADD 1B) Ending Stocks of Residual Fuel Oil (Thousand Barrels) | ||||||||
| Year | Jan | Feb | Mar | Apr | May | Jun | Jul | Aug | Sep | Oct | Nov | Dec |
|---|---|---|---|---|---|---|---|---|---|---|---|---|
| 1993 | 14,261 | 11,663 | 9,421 | 8,705 | 11,409 | 13,052 | 11,579 | 12,533 | 12,378 | 15,054 | 15,416 | 12,587 |
| 1994 | 11,363 | 9,740 | 11,230 | 10,553 | 12,381 | 10,973 | 11,197 | 13,209 | 14,255 | 14,039 | 13,935 | 13,969 |
| 1995 | 13,312 | 10,323 | 10,171 | 9,483 | 9,021 | 9,747 | 9,149 | 9,560 | 10,655 | 11,522 | 11,427 | 9,920 |
| 1996 | 10,112 | 8,689 | 6,626 | 7,837 | 8,233 | 8,206 | 8,305 | 9,203 | 10,298 | 11,489 | 12,956 | 16,001 |
| 1997 | 11,977 | 9,938 | 10,512 | 10,502 | 10,478 | 10,357 | 10,711 | 10,528 | 10,130 | 11,299 | 12,785 | 11,849 |
| 1998 | 11,983 | 10,704 | 10,879 | 9,358 | 10,949 | 12,351 | 11,798 | 12,522 | 12,039 | 14,889 | 13,590 | 15,424 |
| 1999 | 14,929 | 13,157 | 10,675 | 11,777 | 11,373 | 12,337 | 13,996 | 11,856 | 13,157 | 12,892 | 14,725 | 10,077 |
| 2000 | 8,803 | 7,817 | 7,934 | 8,578 | 9,932 | 11,066 | 9,988 | 10,136 | 10,702 | 10,197 | 10,472 | 10,169 |
| 2001 | 10,074 | 10,098 | 9,015 | 9,874 | 12,093 | 11,405 | 11,884 | 9,953 | 10,970 | 10,631 | 11,324 | 12,928 |
| 2002 | 11,721 | 9,693 | 7,294 | 8,145 | 8,725 | 8,461 | 8,425 | 8,700 | 9,080 | 9,644 | 10,590 | 9,250 |
| 2003 | 8,457 | 6,192 | 7,443 | 8,661 | 10,882 | 11,301 | 8,102 | 7,261 | 8,305 | 10,897 | 11,784 | 11,884 |
| 2004 | 9,340 | 11,112 | 11,704 | 9,446 | 9,826 | 10,508 | 8,503 | 10,291 | 9,359 | 11,728 | 12,546 | 13,323 |
| 2005 | 11,819 | 12,363 | 10,553 | 10,118 | 11,923 | 10,168 | 9,624 | 8,557 | 8,728 | 11,025 | 12,043 | 11,733 |
| 2006 | 15,226 | 14,215 | 13,641 | 13,092 | 13,430 | 13,413 | 13,389 | 13,912 | 14,368 | 13,381 | 15,336 | 15,047 |
| 2007 | 14,075 | 10,513 | 11,499 | 11,636 | 12,277 | 11,860 | 11,583 | 11,173 | 12,404 | 11,678 | 11,941 | 11,371 |
| 2008 | 12,100 | 11,439 | 9,954 | 11,507 | 12,424 | 11,560 | 10,922 | 11,294 | 11,622 | 11,096 | 11,162 | 10,272 |
| 2009 | 8,733 | 10,620 | 10,888 | 10,455 | 11,895 | 11,765 | 10,770 | 10,211 | 11,076 | 11,304 | 10,922 | 9,936 |
| 2010 | 11,666 | 11,568 | 12,360 | 12,480 | 14,216 | 12,337 | 12,188 | 10,965 | 11,182 | 10,796 | 10,590 | 11,300 |
| 2011 | 9,619 | 8,406 | 7,450 | 8,972 | 7,379 | 7,897 | 8,010 | 8,446 | 6,983 | 8,945 | 8,586 | 6,936 |
| 2012 | 7,020 | 6,125 | 6,243 | 5,206 | 6,088 | 7,504 | 6,305 | 6,696 | 6,371 | 6,565 | 6,163 | 6,368 |
| 2013 | 5,760 | 5,963 | 7,575 | 7,965 | 7,011 | 7,074 | 6,676 | 6,542 | 5,742 | 5,828 | 5,815 | 6,072 |
| 2014 | 4,729 | 5,211 | 6,473 | 5,022 | 6,151 | 5,918 | 5,591 | 6,196 | 5,470 | 5,621 | 4,998 | 5,230 |
| 2015 | 4,721 | 4,935 | 4,916 | 5,760 | 6,337 | 7,047 | 6,575 | 6,245 | 7,333 | 7,870 | 7,806 | 8,487 |
| 2016 | 8,302 | 8,930 | 7,864 | 8,057 | 6,701 | 5,916 | 6,365 | 7,106 | 7,813 | 7,505 | 7,341 | 7,334 |
| 2017 | 7,423 | 7,057 | 6,621 | 6,448 | 6,504 | 5,973 | 5,194 | 5,588 | 5,508 | 4,783 | 4,969 | 4,889 |
| 2018 | 4,819 | 4,675 | 5,155 | 4,451 | 4,669 | 4,510 | 4,380 | 4,735 | 4,899 | 4,550 | 4,706 | 4,287 |
| 2019 | 4,636 | 4,521 | 5,173 | 5,462 | 5,069 | 6,250 | 6,679 | 6,282 | 6,094 | 6,629 | 6,592 | 6,225 |
| 2020 | 6,309 | 6,391 | 6,118 | 6,598 | 8,675 | 8,395 | 7,162 | 7,101 | 6,191 | 6,259 | 6,554 | 5,887 |
| 2021 | 5,914 | 4,365 | 4,519 | 4,765 | 5,368 | 4,830 | 5,585 | 5,514 | 4,369 | 4,644 | 4,010 | 3,188 |
| 2022 | 3,075 | 3,463 | 3,256 | 3,784 | 4,381 | 4,243 | 3,350 | 3,156 | 3,204 | 3,861 | 4,487 | 4,155 |
| 2023 | 4,461 | 3,912 | 3,232 | 5,267 | 5,464 | 5,270 | 4,531 | 3,439 | 4,118 | 3,931 | 3,418 | 3,500 |
| 2024 | 3,208 | |||||||||||
| - = No Data Reported; -- = Not Applicable; NA = Not Available; W = Withheld to avoid disclosure of individual company data. |
| Release Date: 3/29/2024 |
| Next Release Date: 4/30/2024 |