|
Download Data (XLS File) |
|
||||||||
|
||||||||
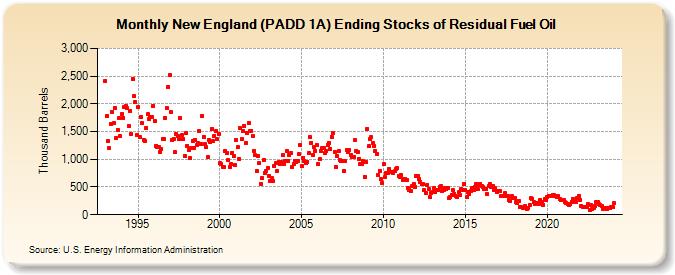
| New England (PADD 1A) Ending Stocks of Residual Fuel Oil (Thousand Barrels) | ||||||||
| Year | Jan | Feb | Mar | Apr | May | Jun | Jul | Aug | Sep | Oct | Nov | Dec |
|---|---|---|---|---|---|---|---|---|---|---|---|---|
| 1993 | 2,413 | 1,775 | 1,332 | 1,195 | 1,628 | 1,860 | 1,653 | 1,927 | 1,387 | 1,534 | 1,743 | 1,414 |
| 1994 | 1,814 | 1,750 | 1,935 | 1,958 | 1,929 | 1,602 | 1,879 | 1,461 | 2,450 | 2,141 | 2,026 | 1,435 |
| 1995 | 1,940 | 1,409 | 1,770 | 1,654 | 1,351 | 1,332 | 1,570 | 1,810 | 1,726 | 1,754 | 1,767 | 1,965 |
| 1996 | 1,687 | 1,248 | 1,228 | 1,230 | 1,124 | 1,177 | 1,367 | 1,362 | 1,746 | 1,920 | 2,305 | 2,517 |
| 1997 | 1,849 | 1,342 | 1,364 | 1,125 | 1,458 | 1,427 | 1,374 | 1,743 | 1,435 | 1,359 | 1,062 | 1,466 |
| 1998 | 1,242 | 1,174 | 1,014 | 1,195 | 1,332 | 1,198 | 1,348 | 1,251 | 1,286 | 1,513 | 1,284 | 1,783 |
| 1999 | 1,409 | 1,281 | 1,216 | 1,038 | 1,354 | 1,303 | 1,551 | 1,321 | 1,425 | 1,507 | 1,358 | 1,458 |
| 2000 | 925 | 908 | 866 | 858 | 1,147 | 1,122 | 978 | 865 | 909 | 1,120 | 1,055 | 901 |
| 2001 | 1,339 | 1,213 | 1,010 | 1,559 | 1,358 | 1,512 | 1,605 | 1,301 | 1,479 | 1,657 | 1,510 | 1,516 |
| 2002 | 1,420 | 1,155 | 1,076 | 786 | 1,067 | 933 | 548 | 659 | 994 | 756 | 794 | 842 |
| 2003 | 705 | 609 | 656 | 614 | 876 | 926 | 792 | 952 | 913 | 948 | 1,072 | 923 |
| 2004 | 971 | 1,148 | 975 | 1,081 | 1,105 | 861 | 912 | 972 | 943 | 974 | 1,095 | 1,260 |
| 2005 | 880 | 1,030 | 977 | 928 | 957 | 1,116 | 1,399 | 1,302 | 1,078 | 1,219 | 1,152 | 1,259 |
| 2006 | 922 | 997 | 1,151 | 1,212 | 1,203 | 1,106 | 1,151 | 1,262 | 1,298 | 1,192 | 1,405 | 1,476 |
| 2007 | 1,137 | 863 | 1,058 | 1,143 | 981 | 962 | 961 | 784 | 965 | 1,161 | 1,137 | 1,173 |
| 2008 | 1,081 | 1,040 | 1,033 | 1,340 | 1,156 | 1,133 | 1,013 | 912 | 918 | 963 | 686 | 953 |
| 2009 | 1,555 | 1,234 | 1,363 | 1,397 | 1,295 | 1,240 | 1,150 | 1,103 | 720 | 793 | 638 | 581 |
| 2010 | 906 | 680 | 760 | 756 | 830 | 765 | 765 | 746 | 780 | 832 | 839 | 699 |
| 2011 | 683 | 711 | 630 | 653 | 640 | 631 | 488 | 449 | 421 | 513 | 562 | 502 |
| 2012 | 696 | 700 | 644 | 596 | 547 | 560 | 437 | 393 | 539 | 458 | 314 | 398 |
| 2013 | 412 | 481 | 404 | 445 | 454 | 497 | 510 | 431 | 451 | 482 | 468 | 489 |
| 2014 | 295 | 316 | 361 | 438 | 379 | 332 | 323 | 401 | 352 | 461 | 445 | 548 |
| 2015 | 440 | 317 | 411 | 369 | 425 | 480 | 454 | 508 | 556 | 455 | 534 | 563 |
| 2016 | 516 | 492 | 470 | 457 | 371 | 522 | 556 | 494 | 509 | 451 | 478 | 402 |
| 2017 | 432 | 429 | 330 | 336 | 329 | 386 | 332 | 329 | 260 | 249 | 342 | 294 |
| 2018 | 293 | 225 | 204 | 255 | 146 | 136 | 127 | 116 | 161 | 111 | 130 | 177 |
| 2019 | 295 | 289 | 225 | 201 | 205 | 209 | 194 | 267 | 237 | 184 | 283 | 270 |
| 2020 | 316 | 337 | 329 | 329 | 358 | 351 | 330 | 311 | 340 | 286 | 266 | 259 |
| 2021 | 264 | 223 | 217 | 202 | 176 | 187 | 235 | 285 | 255 | 232 | 304 | 344 |
| 2022 | 261 | 163 | 140 | 145 | 135 | 142 | 185 | 93 | 171 | 96 | 123 | 149 |
| 2023 | 231 | 229 | 187 | 175 | 163 | 101 | 118 | 125 | 97 | 126 | 120 | 140 |
| 2024 | 133 | |||||||||||
| - = No Data Reported; -- = Not Applicable; NA = Not Available; W = Withheld to avoid disclosure of individual company data. |
| Release Date: 3/29/2024 |
| Next Release Date: 4/30/2024 |