|
Download Data (XLS File) |
|
||||||||
|
||||||||
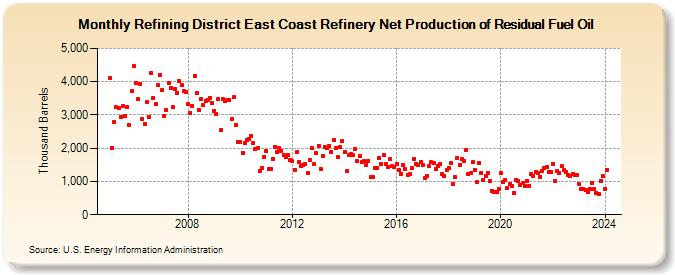
| Refining District East Coast Refinery Net Production of Residual Fuel Oil (Thousand Barrels) | ||||||||
| Year | Jan | Feb | Mar | Apr | May | Jun | Jul | Aug | Sep | Oct | Nov | Dec |
|---|---|---|---|---|---|---|---|---|---|---|---|---|
| 2005 | 4,104 | 2,013 | 2,775 | 3,233 | 3,212 | 2,935 | 3,272 | 2,954 | 3,224 | 2,695 | 3,729 | 4,478 |
| 2006 | 3,952 | 3,472 | 3,934 | 2,889 | 2,734 | 3,388 | 2,944 | 4,258 | 3,508 | 3,327 | 3,892 | 4,207 |
| 2007 | 3,760 | 2,962 | 3,142 | 3,968 | 3,800 | 3,228 | 3,773 | 3,668 | 4,007 | 3,905 | 3,714 | 3,691 |
| 2008 | 3,317 | 3,060 | 3,262 | 4,165 | 3,651 | 3,156 | 3,464 | 3,309 | 3,431 | 3,450 | 3,510 | 3,352 |
| 2009 | 3,119 | 3,033 | 3,483 | 2,549 | 3,466 | 3,425 | 3,451 | 3,461 | 2,864 | 3,538 | 2,698 | 2,191 |
| 2010 | 2,188 | 1,865 | 2,156 | 2,246 | 2,285 | 2,365 | 2,163 | 1,980 | 1,997 | 1,312 | 1,397 | 1,745 |
| 2011 | 1,903 | 1,364 | 1,369 | 1,680 | 2,039 | 1,887 | 2,011 | 1,929 | 1,784 | 1,726 | 1,782 | 1,659 |
| 2012 | 1,602 | 1,353 | 1,885 | 1,575 | 1,451 | 1,497 | 1,519 | 1,258 | 1,642 | 2,013 | 1,516 | 1,852 |
| 2013 | 2,080 | 1,384 | 1,768 | 2,028 | 2,008 | 2,073 | 1,899 | 2,250 | 2,011 | 1,734 | 2,028 | 2,204 |
| 2014 | 1,880 | 1,314 | 1,791 | 1,814 | 1,787 | 1,983 | 1,602 | 1,780 | 1,582 | 1,617 | 1,497 | 1,625 |
| 2015 | 1,119 | 1,133 | 1,405 | 1,401 | 1,717 | 1,526 | 1,802 | 1,529 | 1,445 | 1,676 | 1,452 | 1,442 |
| 2016 | 1,533 | 1,337 | 1,233 | 1,509 | 1,368 | 1,200 | 1,217 | 1,396 | 1,681 | 1,529 | 1,507 | 1,580 |
| 2017 | 1,491 | 1,113 | 1,156 | 1,475 | 1,571 | 1,542 | 1,388 | 1,461 | 1,517 | 1,216 | 1,159 | 1,345 |
| 2018 | 1,418 | 1,554 | 934 | 1,125 | 1,707 | 1,506 | 1,682 | 1,606 | 1,958 | 1,217 | 1,243 | 1,573 |
| 2019 | 1,345 | 977 | 1,556 | 1,258 | 1,042 | 1,153 | 1,239 | 1,003 | 727 | 685 | 675 | 759 |
| 2020 | 1,253 | 989 | 1,044 | 800 | 927 | 875 | 654 | 1,050 | 1,021 | 907 | 941 | 876 |
| 2021 | 1,021 | 868 | 1,235 | 1,172 | 1,290 | 1,265 | 1,143 | 1,324 | 1,405 | 1,443 | 1,282 | 1,287 |
| 2022 | 1,533 | 1,017 | 1,316 | 1,260 | 1,469 | 1,330 | 1,287 | 1,203 | 1,165 | 1,236 | 1,193 | 1,207 |
| 2023 | 917 | 766 | 779 | 735 | 673 | 767 | 949 | 775 | 664 | 627 | 1,024 | 1,149 |
| 2024 | 785 | |||||||||||
| - = No Data Reported; -- = Not Applicable; NA = Not Available; W = Withheld to avoid disclosure of individual company data. |
| Release Date: 3/29/2024 |
| Next Release Date: 4/30/2024 |