|
Download Data (XLS File) |
|
||||||||
|
||||||||
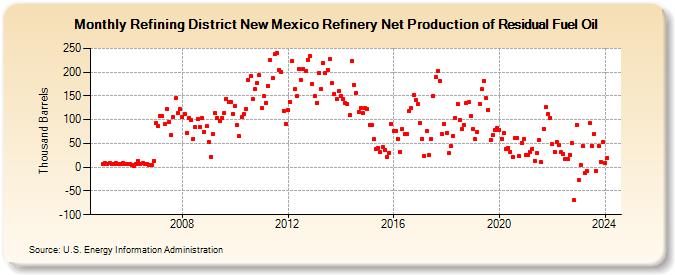
| Refining District New Mexico Refinery Net Production of Residual Fuel Oil (Thousand Barrels) | ||||||||
| Year | Jan | Feb | Mar | Apr | May | Jun | Jul | Aug | Sep | Oct | Nov | Dec |
|---|---|---|---|---|---|---|---|---|---|---|---|---|
| 2005 | 6 | 8 | 6 | 8 | 6 | 6 | 8 | 7 | 6 | 8 | 6 | 6 |
| 2006 | 6 | 5 | 3 | 6 | 14 | 7 | 8 | 7 | 6 | 4 | 5 | 14 |
| 2007 | 94 | 87 | 107 | 107 | 91 | 122 | 95 | 68 | 106 | 145 | 113 | 122 |
| 2008 | 106 | 112 | 71 | 104 | 99 | 60 | 84 | 101 | 85 | 104 | 75 | 86 |
| 2009 | 53 | 22 | 69 | 114 | 104 | 98 | 103 | 115 | 144 | 137 | 138 | 112 |
| 2010 | 128 | 89 | 65 | 105 | 111 | 122 | 184 | 191 | 144 | 164 | 177 | 193 |
| 2011 | 124 | 149 | 136 | 171 | 225 | 188 | 238 | 240 | 205 | 200 | 119 | 91 |
| 2012 | 120 | 138 | 223 | 164 | 149 | 207 | 184 | 207 | 203 | 226 | 233 | 176 |
| 2013 | 150 | 136 | 198 | 165 | 219 | 198 | 205 | 228 | 177 | 155 | 143 | 160 |
| 2014 | 149 | 143 | 136 | 132 | 110 | 223 | 173 | 157 | 117 | 124 | 113 | 124 |
| 2015 | 122 | 88 | 88 | 59 | 39 | 41 | 31 | 43 | 37 | 22 | 30 | 91 |
| 2016 | 76 | 76 | 60 | 32 | 80 | 69 | 70 | 118 | 124 | 151 | 142 | 133 |
| 2017 | 94 | 60 | 24 | 77 | 26 | 60 | 150 | 189 | 203 | 181 | 70 | 90 |
| 2018 | 73 | 29 | 44 | 66 | 103 | 134 | 99 | 80 | 89 | 135 | 137 | 107 |
| 2019 | 80 | 59 | 75 | 134 | 164 | 182 | 145 | 121 | 57 | 67 | 78 | 83 |
| 2020 | 78 | 60 | 72 | 39 | 41 | 33 | 21 | 61 | 61 | 23 | 51 | 59 |
| 2021 | 25 | 26 | 31 | 39 | 14 | 30 | 57 | 10 | 81 | 126 | 111 | 104 |
| 2022 | 48 | 32 | 54 | 46 | 31 | 28 | 17 | 18 | 26 | 50 | -70 | 89 |
| 2023 | -28 | 5 | 44 | -13 | -9 | 92 | 45 | 70 | -7 | 45 | 11 | 52 |
| 2024 | 9 | |||||||||||
| - = No Data Reported; -- = Not Applicable; NA = Not Available; W = Withheld to avoid disclosure of individual company data. |
| Release Date: 3/29/2024 |
| Next Release Date: 4/30/2024 |