|
Download Data (XLS File) |
|
||||||||
|
||||||||
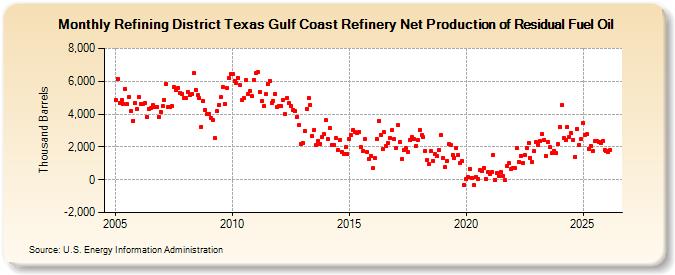
| Refining District Texas Gulf Coast Refinery Net Production of Residual Fuel Oil (Thousand Barrels) | ||||||||
| Year | Jan | Feb | Mar | Apr | May | Jun | Jul | Aug | Sep | Oct | Nov | Dec |
|---|---|---|---|---|---|---|---|---|---|---|---|---|
| 2005 | 4,831 | 6,162 | 4,668 | 4,871 | 4,637 | 5,537 | 4,588 | 5,058 | 4,197 | 3,602 | 4,672 | 4,308 |
| 2006 | 5,031 | 4,609 | 4,640 | 4,678 | 3,826 | 4,331 | 4,355 | 4,529 | 4,412 | 4,407 | 3,836 | 4,155 |
| 2007 | 4,479 | 4,871 | 5,841 | 4,422 | 4,437 | 4,466 | 5,622 | 5,450 | 5,605 | 5,285 | 5,251 | 4,998 |
| 2008 | 5,008 | 5,349 | 5,185 | 5,192 | 6,472 | 5,494 | 5,141 | 4,962 | 3,232 | 4,767 | 4,256 | 3,978 |
| 2009 | 4,004 | 3,762 | 3,641 | 2,539 | 4,166 | 4,537 | 5,020 | 5,636 | 4,643 | 5,593 | 6,169 | 6,412 |
| 2010 | 6,425 | 6,044 | 5,909 | 6,199 | 5,761 | 4,874 | 4,954 | 6,070 | 5,243 | 5,380 | 5,078 | 6,079 |
| 2011 | 6,508 | 6,534 | 5,326 | 4,788 | 4,464 | 5,192 | 5,843 | 6,043 | 4,699 | 4,808 | 5,236 | 4,419 |
| 2012 | 4,476 | 4,480 | 4,879 | 3,999 | 5,007 | 4,669 | 4,495 | 4,273 | 4,206 | 3,827 | 3,304 | 2,167 |
| 2013 | 2,241 | 2,958 | 4,331 | 4,963 | 4,552 | 2,677 | 3,032 | 2,117 | 2,386 | 2,205 | 2,627 | 2,780 |
| 2014 | 3,612 | 2,452 | 3,162 | 2,130 | 2,137 | 2,556 | 1,804 | 2,398 | 1,716 | 1,576 | 1,966 | 1,552 |
| 2015 | 2,458 | 2,706 | 3,045 | 2,886 | 2,816 | 2,936 | 1,980 | 1,773 | 2,472 | 1,681 | 1,271 | 1,462 |
| 2016 | 693 | 1,325 | 2,461 | 3,577 | 2,741 | 1,843 | 2,881 | 2,066 | 2,234 | 2,553 | 3,029 | 2,460 |
| 2017 | 1,950 | 3,308 | 2,308 | 1,254 | 1,834 | 1,925 | 1,689 | 2,433 | 2,579 | 2,456 | 2,059 | 2,408 |
| 2018 | 2,999 | 2,748 | 2,581 | 1,760 | 1,217 | 929 | 1,735 | 1,152 | 1,569 | 1,429 | 1,836 | 2,726 |
| 2019 | 1,353 | 764 | 1,157 | 2,169 | 2,131 | 1,502 | 1,327 | 1,910 | 1,506 | 1,039 | 1,114 | -319 |
| 2020 | 49 | 163 | 667 | 134 | -349 | 151 | 59 | 583 | 502 | 719 | 29 | 467 |
| 2021 | 374 | 458 | 1,526 | 2 | 414 | 216 | 447 | 257 | -40 | 844 | 1,001 | 650 |
| 2022 | 695 | 688 | 1,908 | 1,106 | 1,446 | 1,041 | 1,508 | 1,921 | 2,251 | 1,324 | 1,092 | 1,738 |
| 2023 | 2,297 | 2,123 | 2,343 | 2,776 | 2,440 | 1,426 | 2,327 | 1,973 | 1,609 | 1,769 | 1,636 | 2,166 |
| 2024 | 3,207 | |||||||||||
| - = No Data Reported; -- = Not Applicable; NA = Not Available; W = Withheld to avoid disclosure of individual company data. |
| Release Date: 3/29/2024 |
| Next Release Date: 4/30/2024 |