|
Download Data (XLS File) |
|
||||||||
|
||||||||
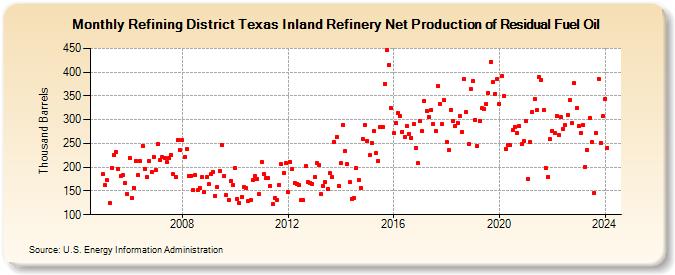
| Refining District Texas Inland Refinery Net Production of Residual Fuel Oil (Thousand Barrels) | ||||||||
| Year | Jan | Feb | Mar | Apr | May | Jun | Jul | Aug | Sep | Oct | Nov | Dec |
|---|---|---|---|---|---|---|---|---|---|---|---|---|
| 2005 | 185 | 162 | 172 | 125 | 199 | 225 | 232 | 197 | 181 | 183 | 167 | 144 |
| 2006 | 220 | 136 | 157 | 214 | 183 | 212 | 245 | 197 | 179 | 213 | 190 | 222 |
| 2007 | 194 | 249 | 215 | 221 | 219 | 210 | 219 | 226 | 185 | 180 | 258 | 237 |
| 2008 | 257 | 221 | 238 | 182 | 182 | 152 | 184 | 152 | 157 | 179 | 147 | 179 |
| 2009 | 164 | 185 | 190 | 140 | 158 | 192 | 247 | 181 | 141 | 132 | 171 | 162 |
| 2010 | 198 | 134 | 125 | 138 | 159 | 156 | 129 | 132 | 172 | 181 | 175 | 144 |
| 2011 | 210 | 185 | 177 | 177 | 161 | 122 | 136 | 131 | 163 | 206 | 188 | 208 |
| 2012 | 148 | 211 | 196 | 167 | 164 | 162 | 130 | 130 | 203 | 168 | 167 | 165 |
| 2013 | 179 | 209 | 204 | 143 | 161 | 168 | 154 | 187 | 179 | 253 | 264 | 161 |
| 2014 | 208 | 289 | 234 | 206 | 168 | 134 | 135 | 198 | 173 | 157 | 259 | 289 |
| 2015 | 256 | 225 | 251 | 276 | 230 | 214 | 285 | 285 | 376 | 446 | 415 | 324 |
| 2016 | 271 | 293 | 313 | 307 | 275 | 264 | 287 | 270 | 262 | 291 | 241 | 208 |
| 2017 | 297 | 276 | 340 | 318 | 306 | 320 | 290 | 276 | 371 | 334 | 290 | 341 |
| 2018 | 254 | 236 | 321 | 297 | 286 | 293 | 307 | 275 | 386 | 316 | 248 | 364 |
| 2019 | 381 | 300 | 244 | 298 | 324 | 323 | 334 | 356 | 422 | 379 | 355 | 385 |
| 2020 | 333 | 391 | 350 | 238 | 246 | 246 | 278 | 285 | 271 | 286 | 248 | 255 |
| 2021 | 298 | 175 | 254 | 317 | 344 | 320 | 389 | 384 | 320 | 199 | 180 | 259 |
| 2022 | 276 | 273 | 308 | 267 | 305 | 281 | 288 | 310 | 341 | 292 | 377 | 325 |
| 2023 | 286 | 273 | 289 | 201 | 236 | 304 | 252 | 145 | 272 | 386 | 251 | 307 |
| 2024 | 343 | |||||||||||
| - = No Data Reported; -- = Not Applicable; NA = Not Available; W = Withheld to avoid disclosure of individual company data. |
| Release Date: 3/29/2024 |
| Next Release Date: 4/30/2024 |