|
Download Data (XLS File) |
|
||||||||
|
||||||||
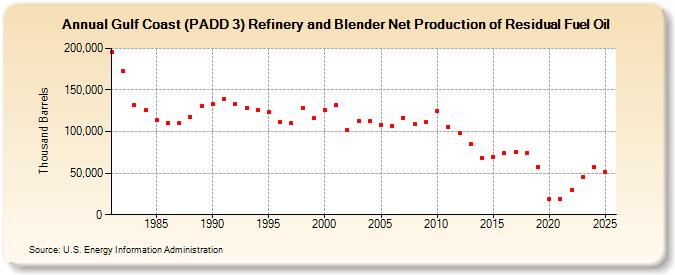
| Gulf Coast (PADD 3) Refinery and Blender Net Production of Residual Fuel Oil (Thousand Barrels) | ||||||||
| Decade | Year-0 | Year-1 | Year-2 | Year-3 | Year-4 | Year-5 | Year-6 | Year-7 | Year-8 | Year-9 |
|---|---|---|---|---|---|---|---|---|---|---|
| 1980's | 196,196 | 172,501 | 131,994 | 125,855 | 113,623 | 110,269 | 110,429 | 117,837 | 130,495 | |
| 1990's | 133,415 | 139,373 | 132,897 | 128,789 | 126,331 | 123,782 | 111,841 | 109,804 | 128,488 | 115,900 |
| 2000's | 125,696 | 132,028 | 101,291 | 112,893 | 112,682 | 107,715 | 106,657 | 116,307 | 108,768 | 111,489 |
| 2010's | 124,510 | 105,792 | 98,102 | 84,442 | 68,626 | 68,804 | 73,935 | 75,597 | 74,443 | 57,702 |
| 2020's | 18,494 | 18,357 | 29,967 | 45,416 |
| - = No Data Reported; -- = Not Applicable; NA = Not Available; W = Withheld to avoid disclosure of individual company data. |
| Release Date: 3/29/2024 |
| Next Release Date: 8/30/2024 |