|
Download Data (XLS File) |
|
||||||||
|
||||||||
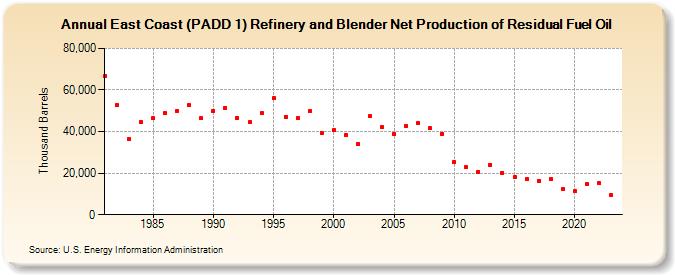
| East Coast (PADD 1) Refinery and Blender Net Production of Residual Fuel Oil (Thousand Barrels) | ||||||||
| Decade | Year-0 | Year-1 | Year-2 | Year-3 | Year-4 | Year-5 | Year-6 | Year-7 | Year-8 | Year-9 |
|---|---|---|---|---|---|---|---|---|---|---|
| 1980's | 66,604 | 52,594 | 36,374 | 44,384 | 46,466 | 48,699 | 50,045 | 52,588 | 46,294 | |
| 1990's | 50,044 | 51,338 | 46,559 | 44,424 | 48,761 | 56,121 | 47,143 | 46,418 | 49,804 | 39,086 |
| 2000's | 40,752 | 38,473 | 34,152 | 47,313 | 42,170 | 38,929 | 42,908 | 44,035 | 41,504 | 38,971 |
| 2010's | 25,379 | 22,716 | 20,562 | 24,131 | 20,258 | 17,985 | 17,012 | 16,374 | 17,292 | 12,221 |
| 2020's | 11,173 | 14,599 | 15,104 | 9,691 |
| - = No Data Reported; -- = Not Applicable; NA = Not Available; W = Withheld to avoid disclosure of individual company data. |
| Release Date: 3/29/2024 |
| Next Release Date: 8/30/2024 |