|
Download Data (XLS File) |
|
||||||||
|
||||||||
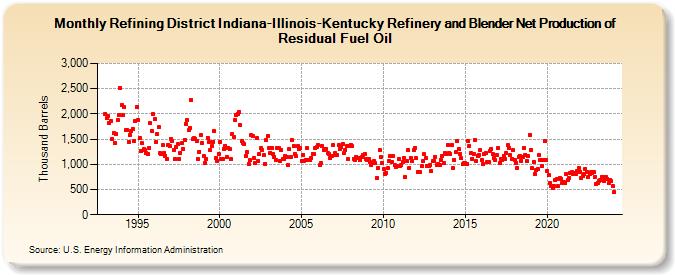
| Refining District Indiana-Illinois-Kentucky Refinery and Blender Net Production of Residual Fuel Oil (Thousand Barrels) | ||||||||
| Year | Jan | Feb | Mar | Apr | May | Jun | Jul | Aug | Sep | Oct | Nov | Dec |
|---|---|---|---|---|---|---|---|---|---|---|---|---|
| 1993 | 1,999 | 1,910 | 1,949 | 1,813 | 1,863 | 1,499 | 1,623 | 1,416 | 1,607 | 1,882 | 1,982 | 2,508 |
| 1994 | 2,177 | 1,973 | 2,129 | 1,675 | 1,677 | 1,444 | 1,583 | 1,653 | 1,700 | 1,466 | 1,852 | 2,128 |
| 1995 | 1,888 | 1,521 | 1,257 | 1,417 | 1,295 | 1,276 | 1,232 | 1,200 | 1,325 | 1,815 | 1,668 | 1,997 |
| 1996 | 1,896 | 1,450 | 1,601 | 1,731 | 1,229 | 1,214 | 1,382 | 1,220 | 1,170 | 1,105 | 1,388 | 1,365 |
| 1997 | 1,510 | 1,470 | 1,279 | 1,110 | 1,339 | 1,393 | 1,099 | 1,223 | 1,426 | 1,299 | 1,492 | 1,802 |
| 1998 | 1,871 | 1,671 | 1,730 | 2,275 | 1,499 | 1,515 | 1,507 | 1,453 | 1,104 | 1,252 | 1,577 | 1,430 |
| 1999 | 1,166 | 1,019 | 1,103 | 1,529 | 1,446 | 1,279 | 1,354 | 1,450 | 1,657 | 1,124 | 1,062 | 1,213 |
| 2000 | 1,448 | 1,110 | 1,104 | 1,311 | 1,368 | 1,148 | 1,332 | 1,308 | 1,105 | 1,596 | 1,548 | 1,875 |
| 2001 | 1,977 | 2,003 | 2,045 | 1,772 | 1,456 | 1,426 | 1,398 | 1,168 | 1,247 | 1,004 | 1,077 | 1,572 |
| 2002 | 1,561 | 1,116 | 1,019 | 1,518 | 1,061 | 1,200 | 1,323 | 1,279 | 1,175 | 1,014 | 1,485 | 1,563 |
| 2003 | 1,324 | 1,231 | 1,321 | 1,202 | 1,152 | 1,084 | 1,332 | 1,330 | 1,075 | 1,290 | 1,100 | 1,108 |
| 2004 | 1,164 | 1,144 | 983 | 1,295 | 1,145 | 1,475 | 1,359 | 1,206 | 1,164 | 1,355 | 1,308 | 1,320 |
| 2005 | 1,075 | 1,185 | 1,074 | 1,095 | 1,324 | 1,084 | 1,078 | 1,129 | 1,205 | 1,208 | 1,326 | 1,342 |
| 2006 | 1,392 | 978 | 1,016 | 1,367 | 1,279 | 1,295 | 1,301 | 1,228 | 1,214 | 1,127 | 1,158 | 1,377 |
| 2007 | 1,219 | 1,180 | 1,187 | 1,374 | 1,309 | 1,351 | 1,400 | 1,228 | 1,290 | 1,357 | 1,101 | 1,369 |
| 2008 | 1,391 | 1,359 | 1,106 | 1,082 | 1,150 | 1,127 | 1,121 | 1,093 | 1,144 | 1,194 | 1,205 | 1,111 |
| 2009 | 1,091 | 1,104 | 1,043 | 981 | 1,035 | 1,067 | 1,017 | 736 | 931 | 1,279 | 1,139 | 1,016 |
| 2010 | 905 | 804 | 837 | 920 | 1,068 | 1,167 | 1,055 | 1,163 | 981 | 937 | 959 | 1,101 |
| 2011 | 971 | 980 | 1,048 | 1,121 | 742 | 1,063 | 1,277 | 926 | 1,123 | 1,070 | 1,287 | 1,328 |
| 2012 | 1,116 | 845 | 855 | 841 | 957 | 1,071 | 1,197 | 1,132 | 968 | 962 | 991 | 859 |
| 2013 | 1,060 | 1,062 | 1,149 | 986 | 1,011 | 978 | 1,090 | 1,169 | 1,027 | 1,223 | 1,198 | 1,387 |
| 2014 | 1,218 | 1,209 | 1,383 | 924 | 1,087 | 1,236 | 1,464 | 1,308 | 1,210 | 1,119 | 997 | 1,025 |
| 2015 | 1,017 | 1,010 | 1,460 | 1,366 | 1,222 | 1,111 | 1,205 | 1,485 | 1,056 | 1,171 | 1,189 | 1,288 |
| 2016 | 1,091 | 1,005 | 1,213 | 1,225 | 1,051 | 1,046 | 1,273 | 1,297 | 1,207 | 1,129 | 1,081 | 1,183 |
| 2017 | 1,320 | 1,019 | 1,107 | 1,084 | 1,174 | 1,102 | 1,225 | 1,377 | 1,330 | 1,185 | 1,111 | 1,274 |
| 2018 | 1,094 | 1,021 | 922 | 1,140 | 1,172 | 1,074 | 1,145 | 1,314 | 1,192 | 1,069 | 1,162 | 1,584 |
| 2019 | 1,286 | 931 | 1,054 | 812 | 879 | 911 | 1,183 | 1,077 | 968 | 1,083 | 1,453 | 1,094 |
| 2020 | 872 | 779 | 636 | 573 | 526 | 568 | 679 | 703 | 561 | 724 | 711 | 623 |
| 2021 | 653 | 624 | 806 | 683 | 734 | 823 | 847 | 817 | 830 | 807 | 863 | 927 |
| 2022 | 855 | 730 | 767 | 801 | 908 | 850 | 741 | 803 | 847 | 834 | 851 | 758 |
| 2023 | 616 | 624 | 673 | 689 | 756 | 741 | 669 | 745 | 717 | 629 | 680 | 665 |
| 2024 | 567 | |||||||||||
| - = No Data Reported; -- = Not Applicable; NA = Not Available; W = Withheld to avoid disclosure of individual company data. |
| Release Date: 3/29/2024 |
| Next Release Date: 4/30/2024 |