|
Download Data (XLS File) |
|
||||||||
|
||||||||
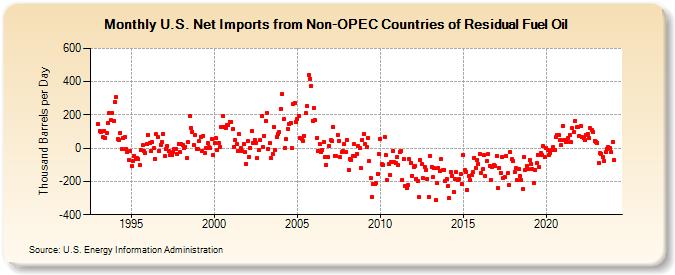
| U.S. Net Imports from Non-OPEC Countries of Residual Fuel Oil (Thousand Barrels per Day) | ||||||||
| Year | Jan | Feb | Mar | Apr | May | Jun | Jul | Aug | Sep | Oct | Nov | Dec |
|---|---|---|---|---|---|---|---|---|---|---|---|---|
| 1993 | 145 | 101 | 100 | 65 | 103 | 64 | 91 | 152 | 214 | 169 | 213 | 165 |
| 1994 | 276 | 305 | 54 | 51 | 94 | -6 | 60 | 65 | -3 | -25 | -70 | -14 |
| 1995 | -105 | -77 | -46 | -68 | -58 | -68 | -103 | -13 | 17 | -14 | -29 | 23 |
| 1996 | 81 | 32 | -17 | 36 | 0 | -65 | 83 | 65 | -15 | 22 | 38 | 87 |
| 1997 | -49 | -7 | 14 | -19 | -43 | -40 | -20 | -6 | -4 | -35 | 28 | -25 |
| 1998 | 28 | 21 | -1 | 9 | -62 | 37 | 191 | 123 | 99 | 18 | 77 | -3 |
| 1999 | -7 | 42 | 69 | -14 | 76 | -28 | 0 | 31 | 5 | 1 | 53 | -41 |
| 2000 | 29 | 59 | -8 | 30 | 8 | 128 | 194 | 129 | 120 | 142 | 140 | 159 |
| 2001 | 159 | 114 | 9 | 49 | 23 | -17 | 84 | 3 | -16 | 26 | -24 | -94 |
| 2002 | 43 | -50 | 2 | 104 | 33 | 51 | 33 | -60 | -13 | 47 | 193 | 7 |
| 2003 | 76 | 166 | 213 | -3 | 34 | -61 | -33 | 129 | -8 | 69 | 85 | 96 |
| 2004 | 237 | 326 | 173 | 3 | 55 | 117 | 145 | 153 | 1 | 268 | 272 | 157 |
| 2005 | 174 | 195 | 59 | 57 | 42 | 76 | 209 | 253 | 440 | 418 | 376 | 165 |
| 2006 | 243 | 169 | 62 | -16 | 28 | -23 | -8 | 38 | -56 | -102 | -55 | 16 |
| 2007 | 47 | 44 | 128 | -44 | -47 | 81 | 46 | -55 | -24 | -18 | 26 | -21 |
| 2008 | 49 | -129 | -65 | -72 | -46 | 23 | -45 | -34 | 11 | 0 | -120 | 52 |
| 2009 | 85 | 23 | 9 | 62 | -80 | -180 | -293 | -218 | -218 | -208 | -156 | -34 |
| 2010 | 54 | -97 | -102 | 69 | -42 | -194 | -95 | -159 | -82 | -17 | -85 | -92 |
| 2011 | -52 | -100 | -24 | -16 | -191 | -68 | -229 | -241 | -220 | -67 | -89 | -165 |
| 2012 | -113 | -105 | -183 | -200 | -296 | -70 | -95 | -182 | -112 | -129 | -184 | -291 |
| 2013 | -45 | -113 | -176 | -120 | -312 | -210 | -119 | -137 | -67 | -132 | -129 | -200 |
| 2014 | -186 | -228 | -301 | -146 | -165 | -264 | -185 | -146 | -192 | -187 | -155 | -218 |
| 2015 | -42 | -134 | -143 | -249 | -170 | -192 | -160 | -145 | -57 | -120 | -71 | -95 |
| 2016 | -33 | -149 | -128 | -42 | -165 | -77 | -37 | -106 | -190 | -112 | -101 | -105 |
| 2017 | -45 | -240 | -117 | -147 | -53 | -181 | -174 | -45 | -152 | -220 | -23 | -67 |
| 2018 | -79 | -142 | -120 | -190 | -126 | -168 | -191 | -245 | -53 | -131 | -106 | -126 |
| 2019 | -69 | -97 | -125 | -207 | -130 | -90 | -40 | -113 | -30 | -38 | 13 | -52 |
| 2020 | -1 | -8 | -39 | -30 | -8 | 6 | -12 | 65 | 79 | 78 | 52 | 18 |
| 2021 | 133 | 52 | 38 | 39 | 60 | 79 | 37 | 119 | 97 | 165 | 127 | 126 |
| 2022 | 76 | 133 | 66 | 61 | 48 | 77 | 88 | 61 | 119 | 109 | 98 | 46 |
| 2023 | 37 | 52 | -112 | -20 | -39 | -55 | -89 | -32 | 6 | 6 | 2 | -25 |
| 2024 | 37 | -71 | -72 | -54 | -26 | -72 | ||||||
| - = No Data Reported; -- = Not Applicable; NA = Not Available; W = Withheld to avoid disclosure of individual company data. |
| Release Date: 8/30/2024 |
| Next Release Date: 9/30/2024 |