|
Download Data (XLS File) |
|
||||||||
|
||||||||
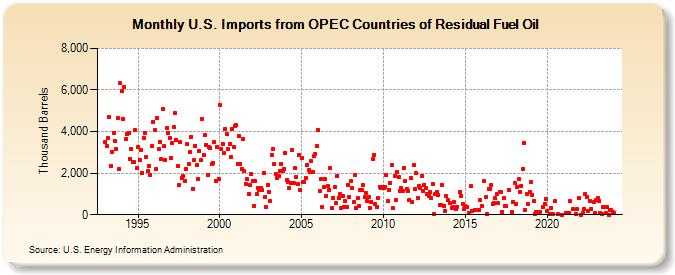
| U.S. Imports from OPEC Countries of Residual Fuel Oil (Thousand Barrels) | ||||||||
| Year | Jan | Feb | Mar | Apr | May | Jun | Jul | Aug | Sep | Oct | Nov | Dec |
|---|---|---|---|---|---|---|---|---|---|---|---|---|
| 1993 | 3,492 | 3,289 | 3,670 | 4,705 | 2,357 | 3,025 | 3,933 | 3,556 | 3,174 | 4,637 | 2,189 | 6,330 |
| 1994 | 5,936 | 4,618 | 6,119 | 3,649 | 3,869 | 3,939 | 2,692 | 3,179 | 2,514 | 2,517 | 4,059 | 2,241 |
| 1995 | 3,273 | 2,633 | 3,121 | 2,012 | 3,704 | 3,954 | 2,763 | 2,094 | 2,362 | 1,906 | 3,294 | 4,463 |
| 1996 | 4,061 | 2,188 | 4,629 | 3,149 | 3,514 | 2,677 | 5,078 | 3,295 | 2,617 | 4,182 | 3,923 | 3,673 |
| 1997 | 2,749 | 3,435 | 4,231 | 4,893 | 3,608 | 2,346 | 1,417 | 3,483 | 1,784 | 1,854 | 1,604 | 2,219 |
| 1998 | 3,388 | 2,421 | 3,036 | 3,752 | 1,250 | 2,633 | 3,312 | 2,368 | 1,697 | 3,064 | 2,613 | 4,599 |
| 1999 | 2,866 | 3,824 | 3,354 | 1,903 | 3,256 | 3,192 | 2,462 | 2,500 | 3,497 | 1,617 | 3,263 | 1,715 |
| 2000 | 5,273 | 3,140 | 3,416 | 2,945 | 4,146 | 3,899 | 3,154 | 3,398 | 2,798 | 4,145 | 3,265 | 4,261 |
| 2001 | 4,297 | 2,459 | 3,767 | 2,463 | 2,193 | 3,619 | 2,081 | 1,472 | 1,697 | 1,005 | 1,426 | 1,951 |
| 2002 | 1,622 | 427 | 1,599 | 1,002 | 1,304 | 1,210 | 1,273 | 1,184 | 2,021 | 861 | 370 | 1,444 |
| 2003 | 1,109 | 663 | 2,887 | 3,182 | 2,419 | 1,955 | 1,773 | 1,858 | 2,103 | 2,417 | 2,093 | 2,208 |
| 2004 | 2,988 | 1,666 | 1,565 | 1,265 | 1,537 | 3,130 | 1,525 | 2,246 | 1,793 | 1,461 | 2,882 | 1,181 |
| 2005 | 2,742 | 1,579 | 1,570 | 1,784 | 2,386 | 2,137 | 2,050 | 2,560 | 2,034 | 2,810 | 2,923 | 3,329 |
| 2006 | 4,079 | 1,118 | 1,728 | 349 | 1,324 | 1,699 | 891 | 1,380 | 1,210 | 2,233 | 299 | 824 |
| 2007 | 1,339 | 563 | 1,884 | 792 | 979 | 320 | 914 | 379 | 642 | 364 | 1,410 | 855 |
| 2008 | 1,621 | 1,267 | 594 | 1,915 | 314 | 783 | 430 | 1,179 | 1,208 | 1,409 | 839 | 1,057 |
| 2009 | 667 | 863 | 321 | 607 | 2,670 | 2,891 | 499 | 373 | 787 | 1,353 | 1,262 | 1,348 |
| 2010 | 1,287 | 1,330 | 1,899 | 669 | 1,201 | 1,549 | 2,375 | 320 | 1,844 | 728 | 2,043 | 1,816 |
| 2011 | 1,154 | 1,272 | 1,164 | 2,267 | 1,602 | 1,237 | 1,137 | 730 | 1,744 | 633 | 2,369 | 1,227 |
| 2012 | 1,992 | 803 | 1,363 | 1,304 | 1,854 | 1,137 | 1,448 | 1,268 | 980 | 912 | 1,085 | 809 |
| 2013 | 1,476 | 25 | 982 | 1,097 | 948 | 457 | 484 | 1,445 | 434 | 195 | 886 | 708 |
| 2014 | 549 | 335 | 377 | 593 | 251 | 377 | 1,103 | 923 | 506 | 276 | ||
| 2015 | 399 | 387 | 100 | 1,367 | 188 | 248 | 240 | 685 | ||||
| 2016 | 421 | 1,602 | 848 | 32 | 1,254 | 1,215 | 1,429 | 507 | 546 | 780 | 985 | |
| 2017 | 550 | 1,090 | 1,072 | 131 | 788 | 401 | 405 | 1,212 | 122 | 609 | ||
| 2018 | 1,525 | 509 | 1,342 | 1,723 | 1,083 | 1,389 | 2,188 | 3,432 | 250 | 976 | 517 | 1,100 |
| 2019 | 1,554 | 966 | 647 | 20 | 150 | 132 | 374 | 523 | 761 | |||
| 2020 | 198 | 51 | 337 | 16 | 656 | 17 | 2 | |||||
| 2021 | 74 | 60 | 645 | 256 | 22 | 263 | 827 | |||||
| 2022 | 8 | 65 | 279 | 1,003 | 848 | 168 | 676 | 272 | 614 | 98 | ||
| 2023 | 684 | 785 | 679 | 88 | 25 | 368 | 374 | 69 | 381 | 1 | 214 | 217 |
| 2024 | 114 | 103 | ||||||||||
| - = No Data Reported; -- = Not Applicable; NA = Not Available; W = Withheld to avoid disclosure of individual company data. |
| Release Date: 4/30/2024 |
| Next Release Date: 5/31/2024 |