|
Download Data (XLS File) |
|
||||||||
|
||||||||
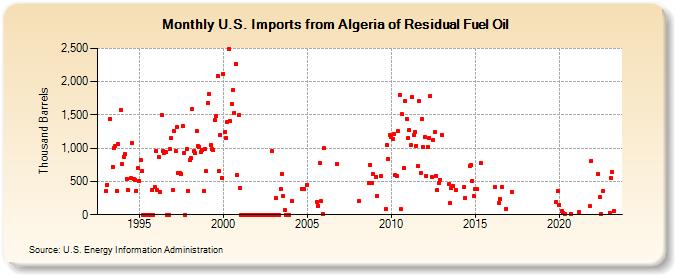
| U.S. Imports from Algeria of Residual Fuel Oil (Thousand Barrels) | ||||||||
| Year | Jan | Feb | Mar | Apr | May | Jun | Jul | Aug | Sep | Oct | Nov | Dec |
|---|---|---|---|---|---|---|---|---|---|---|---|---|
| 1993 | 349 | 450 | 1,441 | 724 | 1,002 | 1,035 | 363 | 1,057 | 1,579 | |||
| 1994 | 759 | 875 | 911 | 543 | 368 | 545 | 1,080 | 541 | 528 | 362 | 698 | |
| 1995 | 509 | 815 | 650 | 0 | 0 | 0 | 0 | 0 | 0 | 367 | 0 | 415 |
| 1996 | 956 | 364 | 861 | 337 | 1,505 | 959 | 928 | 939 | 0 | 0 | 981 | 1,160 |
| 1997 | 364 | 1,252 | 960 | 1,320 | 622 | 621 | 607 | 1,340 | 935 | 0 | 982 | 362 |
| 1998 | 824 | 845 | 1,595 | 951 | 927 | 1,261 | 1,029 | 1,018 | 939 | 972 | 352 | 988 |
| 1999 | 652 | 1,679 | 1,820 | 1,042 | 987 | 974 | 1,421 | 1,480 | 2,080 | 652 | 1,203 | 558 |
| 2000 | 2,118 | 1,240 | 1,157 | 1,398 | 2,484 | 1,406 | 1,665 | 1,878 | 1,526 | 2,266 | 594 | 1,495 |
| 2001 | 404 | 0 | 0 | 0 | 0 | 0 | 0 | 0 | 0 | 0 | 0 | 0 |
| 2002 | 0 | 0 | 0 | 0 | 0 | 0 | 0 | 0 | 0 | 0 | 0 | 952 |
| 2003 | 0 | 0 | 248 | 0 | 0 | 381 | 616 | 279 | 71 | 0 | 0 | 0 |
| 2004 | 209 | 394 | 384 | |||||||||
| 2005 | 454 | 194 | 137 | 773 | 199 | 4 | ||||||
| 2006 | 999 | 762 | ||||||||||
| 2008 | 206 | 474 | 751 | 470 | 614 | |||||||
| 2009 | 574 | 284 | 584 | 89 | 1,043 | 841 | 1,199 | |||||
| 2010 | 1,162 | 1,140 | 1,218 | 590 | 583 | 1,252 | 1,801 | 81 | 1,510 | 704 | 1,710 | 1,442 |
| 2011 | 1,154 | 1,272 | 1,042 | 1,770 | 1,194 | 1,237 | 1,037 | 730 | 1,706 | 630 | 1,433 | 1,018 |
| 2012 | 1,166 | 582 | 1,016 | 1,151 | 1,790 | 560 | 1,125 | 1,244 | 582 | 365 | 470 | 528 |
| 2013 | 1,201 | 457 | 175 | 400 | 434 | 365 | ||||||
| 2014 | 415 | 251 | 735 | 753 | 506 | 276 | ||||||
| 2015 | 384 | 387 | 773 | |||||||||
| 2016 | 421 | 175 | 231 | 417 | 91 | |||||||
| 2017 | 347 | |||||||||||
| 2019 | 198 | 353 | ||||||||||
| 2020 | 146 | 51 | 24 | 16 | 15 | |||||||
| 2021 | 37 | 126 | 812 | |||||||||
| 2022 | 615 | 265 | 5 | 349 | ||||||||
| 2023 | 29 | 557 | 641 | 56 | ||||||||
| - = No Data Reported; -- = Not Applicable; NA = Not Available; W = Withheld to avoid disclosure of individual company data. |
| Release Date: 3/29/2024 |
| Next Release Date: 4/30/2024 |