|
Download Data (XLS File) |
|
||||||||
|
||||||||
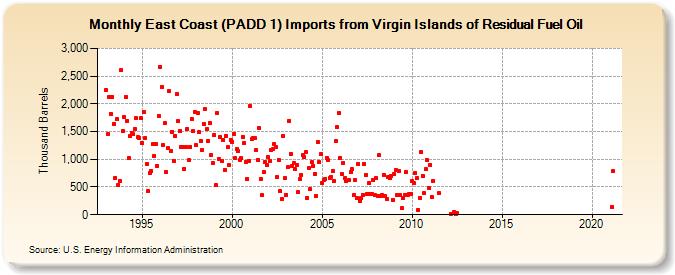
| East Coast (PADD 1) Imports from Virgin Islands of Residual Fuel Oil (Thousand Barrels) | ||||||||
| Year | Jan | Feb | Mar | Apr | May | Jun | Jul | Aug | Sep | Oct | Nov | Dec |
|---|---|---|---|---|---|---|---|---|---|---|---|---|
| 1993 | 2,246 | 1,459 | 2,123 | 1,825 | 2,132 | 1,641 | 659 | 1,724 | 538 | 614 | 2,607 | 1,511 |
| 1994 | 1,768 | 2,128 | 1,697 | 1,020 | 1,422 | 1,468 | 1,449 | 1,547 | 1,739 | 1,395 | 1,392 | 1,737 |
| 1995 | 1,290 | 1,845 | 1,384 | 922 | 419 | 755 | 785 | 1,272 | 1,061 | 1,272 | 876 | 1,781 |
| 1996 | 2,669 | 2,309 | 1,251 | 1,651 | 766 | 1,197 | 2,226 | 1,142 | 1,497 | 974 | 1,422 | 2,174 |
| 1997 | 1,683 | 1,503 | 1,224 | 1,221 | 833 | 1,230 | 1,547 | 979 | 1,226 | 1,730 | 1,508 | 1,861 |
| 1998 | 1,249 | 1,832 | 1,486 | 1,326 | 1,176 | 1,639 | 1,901 | 1,549 | 1,331 | 1,656 | 1,080 | 941 |
| 1999 | 1,442 | 531 | 1,833 | 1,010 | 1,407 | 974 | 1,348 | 815 | 1,424 | 1,215 | 891 | 1,347 |
| 2000 | 1,320 | 1,464 | 1,018 | 1,181 | 1,142 | 993 | 1,019 | 1,408 | 1,288 | 957 | 647 | 972 |
| 2001 | 1,962 | 1,363 | 1,381 | 1,377 | 1,160 | 990 | 1,557 | 649 | 355 | 769 | 950 | 899 |
| 2002 | 1,040 | 977 | 1,164 | 1,178 | 1,277 | 1,214 | 673 | 994 | 421 | 282 | 1,417 | 654 |
| 2003 | 361 | 855 | 1,697 | 1,103 | 876 | 927 | 820 | 904 | 409 | 636 | 719 | 1,073 |
| 2004 | 1,042 | 1,126 | 301 | 839 | 463 | 944 | 880 | 735 | 344 | 1,308 | 953 | 1,090 |
| 2005 | 575 | 624 | 651 | 1,021 | 979 | 665 | 687 | 787 | 612 | 1,324 | 1,586 | 1,834 |
| 2006 | 1,014 | 741 | 939 | 656 | 607 | 624 | 769 | 817 | 354 | 620 | 302 | |
| 2007 | 918 | 242 | 305 | 357 | 919 | 723 | 373 | 564 | 376 | 378 | 635 | 362 |
| 2008 | 666 | 345 | 1,072 | 335 | 355 | 725 | 330 | 288 | 674 | 666 | 707 | 270 |
| 2009 | 727 | 804 | 350 | 788 | 350 | 120 | 301 | 356 | 772 | 347 | 370 | 379 |
| 2010 | 602 | 569 | 744 | 655 | 89 | 310 | 1,140 | 699 | 387 | 816 | 979 | 477 |
| 2011 | 895 | 323 | 607 | 385 | ||||||||
| 2012 | 19 | 52 | 8 | 30 | ||||||||
| 2021 | 135 | 784 | ||||||||||
| - = No Data Reported; -- = Not Applicable; NA = Not Available; W = Withheld to avoid disclosure of individual company data. |
| Release Date: 3/29/2024 |
| Next Release Date: 4/30/2024 |