|
Download Data (XLS File) |
|
||||||||
|
||||||||
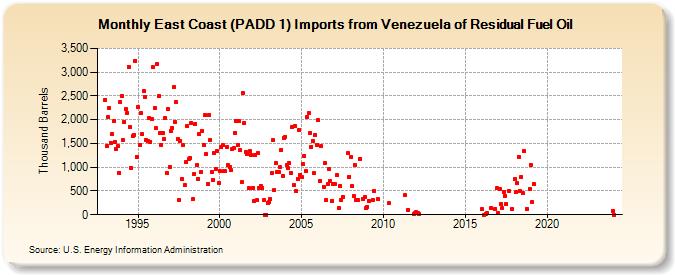
| East Coast (PADD 1) Imports from Venezuela of Residual Fuel Oil (Thousand Barrels) | ||||||||
| Year | Jan | Feb | Mar | Apr | May | Jun | Jul | Aug | Sep | Oct | Nov | Dec |
|---|---|---|---|---|---|---|---|---|---|---|---|---|
| 1993 | 2,420 | 1,448 | 2,051 | 2,246 | 1,519 | 1,695 | 1,965 | 1,535 | 1,380 | 1,444 | 887 | 2,362 |
| 1994 | 2,499 | 1,572 | 1,958 | 2,218 | 2,148 | 3,117 | 1,849 | 993 | 1,659 | 1,686 | 3,243 | 1,221 |
| 1995 | 2,268 | 1,458 | 2,132 | 1,697 | 2,601 | 2,484 | 1,568 | 1,556 | 2,037 | 1,539 | 2,010 | 3,100 |
| 1996 | 2,252 | 1,824 | 3,164 | 2,491 | 1,730 | 1,470 | 1,727 | 1,598 | 2,036 | 877 | 2,228 | 1,003 |
| 1997 | 1,770 | 1,823 | 2,686 | 1,951 | 2,367 | 1,585 | 311 | 1,554 | 762 | 1,466 | 622 | 1,108 |
| 1998 | 1,858 | 1,165 | 1,202 | 1,930 | 323 | 854 | 1,917 | 1,046 | 758 | 1,691 | 908 | 1,770 |
| 1999 | 1,474 | 2,103 | 1,282 | 645 | 2,101 | 1,567 | 891 | 735 | 1,309 | 965 | 1,338 | 670 |
| 2000 | 919 | 1,424 | 1,460 | 911 | 912 | 1,426 | 1,043 | 995 | 932 | 1,377 | 1,397 | 1,729 |
| 2001 | 1,969 | 1,465 | 1,969 | 1,356 | 683 | 2,555 | 1,934 | 1,318 | 1,279 | 556 | 1,334 | 1,249 |
| 2002 | 563 | 284 | 1,258 | 303 | 1,300 | 561 | 613 | 563 | 301 | 0 | 0 | 254 |
| 2003 | 271 | 321 | 872 | 1,568 | 516 | 1,078 | 904 | 903 | 996 | 1,370 | 820 | 1,615 |
| 2004 | 1,640 | 1,046 | 976 | 1,082 | 881 | 1,842 | 630 | 1,862 | 489 | 755 | 1,779 | 833 |
| 2005 | 787 | 1,058 | 1,232 | 918 | 2,055 | 2,137 | 1,718 | 1,428 | 1,559 | 872 | 1,680 | 1,464 |
| 2006 | 1,987 | 710 | 1,436 | 593 | 1,085 | 313 | 647 | 968 | 703 | 299 | 650 | |
| 2007 | 636 | 827 | 140 | 603 | 320 | 368 | 1,293 | 800 | ||||
| 2008 | 1,215 | 600 | 393 | 1,043 | 314 | 315 | 1,179 | 330 | 369 | 148 | ||
| 2009 | 163 | 289 | 320 | 508 | 321 | |||||||
| 2010 | 241 | |||||||||||
| 2011 | 408 | 100 | 8 | 45 | ||||||||
| 2012 | 48 | 31 | 8 | |||||||||
| 2016 | 114 | 4 | 8 | 32 | 146 | 122 | 552 | |||||
| 2017 | 35 | 539 | 217 | 131 | 478 | 401 | 231 | 508 | 122 | |||
| 2018 | 750 | 480 | 659 | 1,222 | 501 | 802 | 449 | 1,332 | 130 | 542 | ||
| 2019 | 1,049 | 271 | 647 | |||||||||
| 2024 | 86 | |||||||||||
| - = No Data Reported; -- = Not Applicable; NA = Not Available; W = Withheld to avoid disclosure of individual company data. |
| Release Date: 3/29/2024 |
| Next Release Date: 4/30/2024 |