|
Download Data (XLS File) |
|
||||||||
|
||||||||
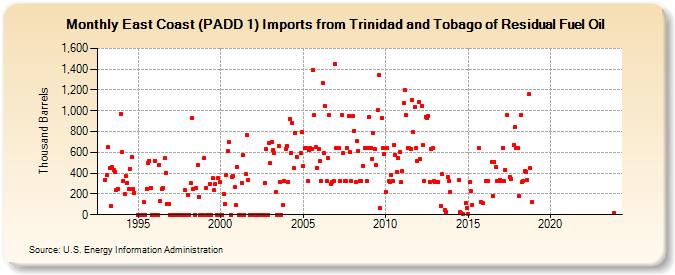
| East Coast (PADD 1) Imports from Trinidad and Tobago of Residual Fuel Oil (Thousand Barrels) | ||||||||
| Year | Jan | Feb | Mar | Apr | May | Jun | Jul | Aug | Sep | Oct | Nov | Dec |
|---|---|---|---|---|---|---|---|---|---|---|---|---|
| 1993 | 335 | 379 | 651 | 446 | 84 | 457 | 432 | 408 | 236 | 251 | 971 | |
| 1994 | 601 | 329 | 204 | 372 | 307 | 245 | 439 | 555 | 247 | 211 | ||
| 1995 | 0 | 0 | 0 | 0 | 122 | 0 | 247 | 497 | 519 | 261 | 0 | 0 |
| 1996 | 521 | 0 | 0 | 480 | 128 | 250 | 261 | 543 | 404 | 104 | 100 | 0 |
| 1997 | 0 | 0 | 0 | 0 | 0 | 0 | 0 | 0 | 0 | 0 | 234 | 0 |
| 1998 | 193 | 0 | 307 | 926 | 248 | 0 | 260 | 475 | 175 | 0 | 0 | 0 |
| 1999 | 546 | 260 | 0 | 0 | 300 | 0 | 350 | 240 | 298 | 0 | 350 | 310 |
| 2000 | 0 | 0 | 200 | 101 | 380 | 615 | 697 | 0 | 363 | 371 | 264 | 91 |
| 2001 | 458 | 0 | 0 | 306 | 573 | 0 | 389 | 768 | 336 | 0 | 0 | 0 |
| 2002 | 0 | 0 | 0 | 0 | 0 | 0 | 0 | 0 | 304 | 630 | 0 | 687 |
| 2003 | 497 | 704 | 619 | 590 | 218 | 0 | 660 | 319 | 0 | 91 | 320 | 635 |
| 2004 | 665 | 319 | 923 | 591 | 880 | 448 | 789 | 558 | 589 | 791 | ||
| 2005 | 466 | 644 | 646 | 320 | 627 | 640 | 634 | 1,396 | 955 | 649 | 454 | 633 |
| 2006 | 514 | 320 | 1,270 | 592 | 1,042 | 320 | 544 | 960 | 294 | 313 | 321 | 1,449 |
| 2007 | 639 | 640 | 641 | 320 | 961 | 591 | 320 | 322 | 640 | 950 | 602 | 321 |
| 2008 | 949 | 809 | 315 | 711 | 617 | 325 | 321 | 469 | 640 | 320 | 641 | |
| 2009 | 941 | 642 | 540 | 789 | 631 | 475 | 1,007 | 1,342 | 60 | 931 | 640 | 585 |
| 2010 | 221 | 640 | 320 | 318 | 380 | 320 | 670 | 578 | 413 | 545 | 599 | 310 |
| 2011 | 419 | 1,071 | 1,197 | 959 | 640 | 640 | 634 | 1,108 | 798 | 1,037 | 641 | 515 |
| 2012 | 1,088 | 534 | 1,047 | 668 | 321 | 943 | 934 | 952 | 319 | 635 | 639 | 320 |
| 2013 | 318 | 311 | 87 | 387 | 50 | 24 | 366 | 320 | 223 | |||
| 2014 | 330 | 25 | 16 | 3 | 110 | 66 | ||||||
| 2015 | 5 | 319 | 224 | 96 | 640 | 120 | 108 | |||||
| 2016 | 320 | 320 | 509 | 181 | 509 | 455 | 320 | 325 | 338 | |||
| 2017 | 322 | 643 | 320 | 432 | 962 | 364 | 344 | 672 | 846 | 642 | ||
| 2018 | 642 | 182 | 958 | 319 | 320 | 420 | 411 | 334 | 1,161 | 447 | 120 | |
| 2023 | 17 | |||||||||||
| - = No Data Reported; -- = Not Applicable; NA = Not Available; W = Withheld to avoid disclosure of individual company data. |
| Release Date: 3/29/2024 |
| Next Release Date: 4/30/2024 |