|
Download Data (XLS File) |
|
||||||||
|
||||||||
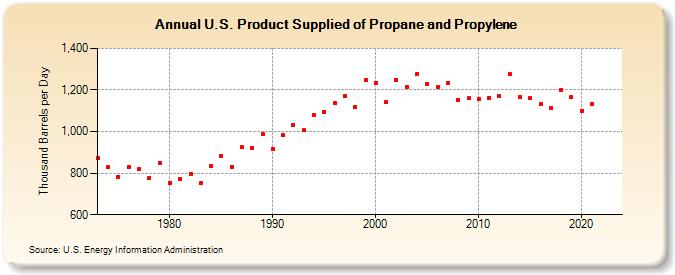
| U.S. Product Supplied of Propane and Propylene (Thousand Barrels per Day) | ||||||||
| Decade | Year-0 | Year-1 | Year-2 | Year-3 | Year-4 | Year-5 | Year-6 | Year-7 | Year-8 | Year-9 |
|---|---|---|---|---|---|---|---|---|---|---|
| 1970's | 872 | 830 | 783 | 830 | 821 | 778 | 849 | |||
| 1980's | 754 | 773 | 798 | 751 | 833 | 883 | 831 | 924 | 923 | 990 |
| 1990's | 917 | 982 | 1,032 | 1,006 | 1,082 | 1,096 | 1,136 | 1,170 | 1,120 | 1,246 |
| 2000's | 1,235 | 1,142 | 1,248 | 1,215 | 1,276 | 1,229 | 1,215 | 1,235 | 1,154 | 1,160 |
| 2010's | 1,157 | 1,161 | 1,170 | 1,275 | 1,167 | 1,160 | 1,134 | 1,111 | 1,199 | 1,166 |
| 2020's | 1,101 | 1,134 | -- | -- |
| - = No Data Reported; -- = Not Applicable; NA = Not Available; W = Withheld to avoid disclosure of individual company data. |
| Release Date: 8/30/2024 |
| Next Release Date: 8/29/2025 |