|
Download Data (XLS File) |
|
||||||||
|
||||||||
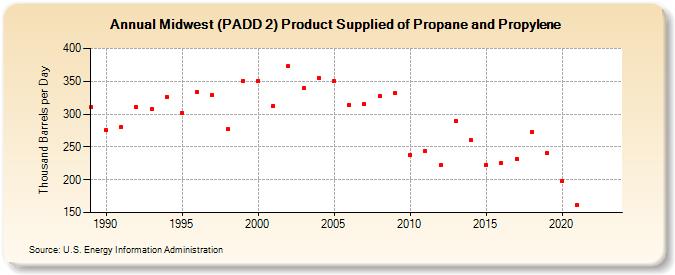
| Midwest (PADD 2) Product Supplied of Propane and Propylene (Thousand Barrels per Day) | ||||||||
| Decade | Year-0 | Year-1 | Year-2 | Year-3 | Year-4 | Year-5 | Year-6 | Year-7 | Year-8 | Year-9 |
|---|---|---|---|---|---|---|---|---|---|---|
| 1980's | 310 | |||||||||
| 1990's | 275 | 280 | 310 | 307 | 326 | 302 | 334 | 329 | 277 | 350 |
| 2000's | 351 | 312 | 373 | 339 | 355 | 350 | 314 | 315 | 327 | 332 |
| 2010's | 238 | 243 | 222 | 290 | 260 | 223 | 226 | 232 | 273 | 240 |
| 2020's | 198 | 161 | -- | -- |
| - = No Data Reported; -- = Not Applicable; NA = Not Available; W = Withheld to avoid disclosure of individual company data. |
| Release Date: 8/30/2024 |
| Next Release Date: 8/29/2025 |