|
Download Data (XLS File) |
|
||||||||
|
||||||||
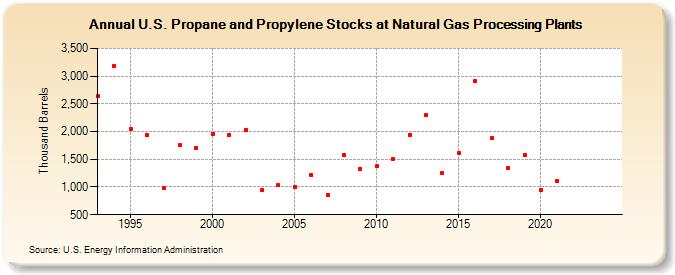
| U.S. Propane and Propylene Stocks at Natural Gas Processing Plants (Thousand Barrels) | ||||||||
| Decade | Year-0 | Year-1 | Year-2 | Year-3 | Year-4 | Year-5 | Year-6 | Year-7 | Year-8 | Year-9 |
|---|---|---|---|---|---|---|---|---|---|---|
| 1990's | 2,642 | 3,178 | 2,049 | 1,943 | 984 | 1,754 | 1,709 | |||
| 2000's | 1,963 | 1,943 | 2,030 | 949 | 1,038 | 996 | 1,218 | 864 | 1,575 | 1,329 |
| 2010's | 1,371 | 1,505 | 1,944 | 2,297 | 1,246 | 1,611 | 2,906 | 1,881 | 1,350 | 1,580 |
| 2020's | 943 | 1,112 | -- | -- |
| - = No Data Reported; -- = Not Applicable; NA = Not Available; W = Withheld to avoid disclosure of individual company data. |
| Release Date: 8/30/2024 |
| Next Release Date: 8/29/2025 |