|
Download Data (XLS File) |
|
||||||||
|
||||||||
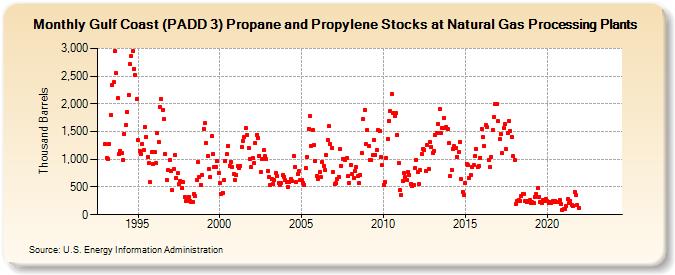
| Gulf Coast (PADD 3) Propane and Propylene Stocks at Natural Gas Processing Plants (Thousand Barrels) | ||||||||
| Year | Jan | Feb | Mar | Apr | May | Jun | Jul | Aug | Sep | Oct | Nov | Dec |
|---|---|---|---|---|---|---|---|---|---|---|---|---|
| 1993 | 1,274 | 1,018 | 1,012 | 1,271 | 1,803 | 2,346 | 2,387 | 2,949 | 2,549 | 2,099 | 1,090 | 1,151 |
| 1994 | 1,106 | 994 | 1,464 | 1,619 | 1,861 | 2,164 | 2,710 | 2,856 | 2,946 | 2,628 | 2,523 | 2,091 |
| 1995 | 1,344 | 1,143 | 1,096 | 1,278 | 1,164 | 1,588 | 1,399 | 1,042 | 930 | 582 | 1,127 | 920 |
| 1996 | 1,136 | 935 | 1,466 | 1,309 | 1,938 | 2,085 | 1,891 | 1,726 | 1,088 | 627 | 805 | 983 |
| 1997 | 784 | 439 | 819 | 1,071 | 664 | 744 | 549 | 610 | 479 | 585 | 316 | 244 |
| 1998 | 277 | 323 | 254 | 232 | 234 | 376 | 329 | 620 | 943 | 689 | 544 | 719 |
| 1999 | 1,553 | 1,647 | 1,289 | 1,054 | 828 | 679 | 1,411 | 1,093 | 855 | 866 | 967 | 761 |
| 2000 | 568 | 370 | 399 | 626 | 975 | 1,087 | 1,247 | 885 | 956 | 863 | 737 | 631 |
| 2001 | 710 | 872 | 835 | 883 | 1,227 | 1,336 | 1,410 | 1,567 | 1,439 | 1,205 | 1,002 | 855 |
| 2002 | 1,025 | 936 | 1,295 | 1,443 | 1,381 | 1,065 | 770 | 997 | 1,167 | 1,054 | 1,004 | 788 |
| 2003 | 683 | 533 | 645 | 554 | 626 | 755 | 690 | 573 | 529 | 566 | 720 | 687 |
| 2004 | 621 | 589 | 495 | 582 | 646 | 615 | 1,062 | 868 | 590 | 734 | 782 | 624 |
| 2005 | 627 | 581 | 541 | 841 | 1,049 | 1,551 | 1,773 | 1,247 | 1,526 | 1,253 | 974 | 703 |
| 2006 | 651 | 766 | 675 | 949 | 884 | 808 | 1,078 | 1,343 | 1,594 | 1,274 | 1,210 | 778 |
| 2007 | 551 | 564 | 648 | 688 | 1,183 | 884 | 1,012 | 1,012 | 993 | 1,017 | 690 | 580 |
| 2008 | 894 | 742 | 665 | 791 | 857 | 695 | 569 | 721 | 1,109 | 1,718 | 1,891 | 1,273 |
| 2009 | 1,531 | 1,244 | 988 | 978 | 1,075 | 1,356 | 1,083 | 1,165 | 1,532 | 1,501 | 1,042 | 895 |
| 2010 | 543 | 593 | 1,025 | 1,369 | 1,697 | 1,866 | 2,180 | 1,839 | 1,786 | 1,833 | 1,438 | 935 |
| 2011 | 442 | 360 | 605 | 749 | 677 | 629 | 773 | 718 | 561 | 523 | 541 | 836 |
| 2012 | 991 | 776 | 561 | 802 | 1,097 | 1,188 | 1,172 | 790 | 1,264 | 816 | 1,317 | 1,217 |
| 2013 | 1,116 | 1,158 | 1,443 | 1,476 | 1,641 | 1,906 | 1,477 | 1,573 | 1,750 | 1,570 | 1,587 | 1,555 |
| 2014 | 1,292 | 701 | 814 | 1,193 | 1,233 | 1,210 | 1,050 | 1,126 | 1,310 | 637 | 418 | 347 |
| 2015 | 568 | 917 | 895 | 667 | 717 | 864 | 893 | 1,064 | 1,188 | 852 | 878 | 1,031 |
| 2016 | 1,553 | 1,404 | 1,239 | 1,614 | 1,579 | 984 | 860 | 1,039 | 1,527 | 1,758 | 1,991 | 1,995 |
| 2017 | 1,685 | 1,365 | 1,450 | 1,106 | 1,560 | 1,632 | 1,184 | 1,474 | 1,686 | 1,511 | 1,402 | 1,051 |
| 2018 | 987 | 195 | 254 | 270 | 256 | 330 | 376 | 373 | 254 | 238 | 243 | 257 |
| 2019 | 214 | 224 | 210 | 326 | 370 | 479 | 325 | 234 | 208 | 263 | 247 | 279 |
| 2020 | 245 | 204 | 225 | 218 | 256 | 228 | 248 | 229 | 231 | 263 | 187 | 78 |
| 2021 | 97 | 110 | 165 | 277 | 203 | 244 | 182 | 166 | 406 | 347 | 169 | 127 |
| 2022 | -- | -- | -- | -- | -- | -- | -- | -- | -- | -- | -- | -- |
| 2023 | -- | -- | -- | -- | -- | -- | -- | -- | -- | -- | -- | -- |
| 2024 | -- | |||||||||||
| - = No Data Reported; -- = Not Applicable; NA = Not Available; W = Withheld to avoid disclosure of individual company data. |
| Release Date: 3/29/2024 |
| Next Release Date: 4/30/2024 |