|
Download Data (XLS File) |
|
||||||||
|
||||||||
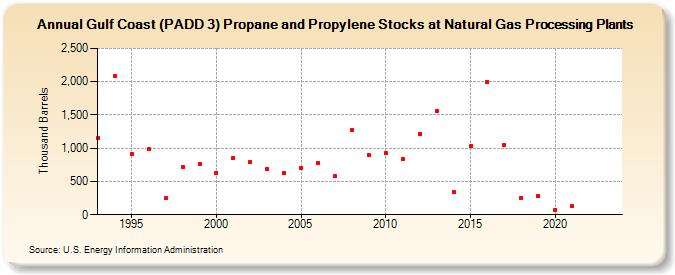
| Gulf Coast (PADD 3) Propane and Propylene Stocks at Natural Gas Processing Plants (Thousand Barrels) | ||||||||
| Decade | Year-0 | Year-1 | Year-2 | Year-3 | Year-4 | Year-5 | Year-6 | Year-7 | Year-8 | Year-9 |
|---|---|---|---|---|---|---|---|---|---|---|
| 1990's | 1,151 | 2,091 | 920 | 983 | 244 | 719 | 761 | |||
| 2000's | 631 | 855 | 788 | 687 | 624 | 703 | 778 | 580 | 1,273 | 895 |
| 2010's | 935 | 836 | 1,217 | 1,555 | 347 | 1,031 | 1,995 | 1,051 | 257 | 279 |
| 2020's | 78 | 127 | -- | -- |
| - = No Data Reported; -- = Not Applicable; NA = Not Available; W = Withheld to avoid disclosure of individual company data. |
| Release Date: 8/30/2024 |
| Next Release Date: 8/29/2025 |