|
Download Data (XLS File) |
|
||||||||
|
||||||||
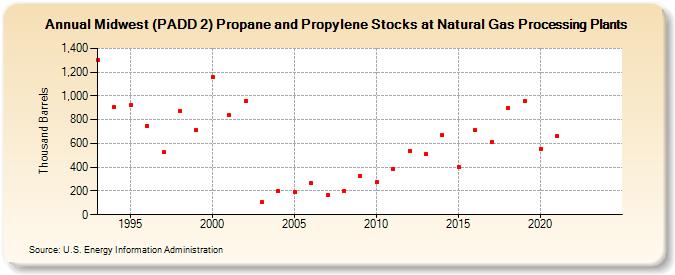
| Midwest (PADD 2) Propane and Propylene Stocks at Natural Gas Processing Plants (Thousand Barrels) | ||||||||
| Decade | Year-0 | Year-1 | Year-2 | Year-3 | Year-4 | Year-5 | Year-6 | Year-7 | Year-8 | Year-9 |
|---|---|---|---|---|---|---|---|---|---|---|
| 1990's | 1,302 | 905 | 923 | 745 | 524 | 870 | 710 | |||
| 2000's | 1,158 | 836 | 957 | 103 | 198 | 188 | 265 | 163 | 197 | 330 |
| 2010's | 272 | 384 | 538 | 514 | 671 | 404 | 709 | 610 | 898 | 954 |
| 2020's | 557 | 664 | -- | -- |
| - = No Data Reported; -- = Not Applicable; NA = Not Available; W = Withheld to avoid disclosure of individual company data. |
| Release Date: 3/29/2024 |
| Next Release Date: 8/30/2024 |