|
Download Data (XLS File) |
|
||||||||
|
||||||||
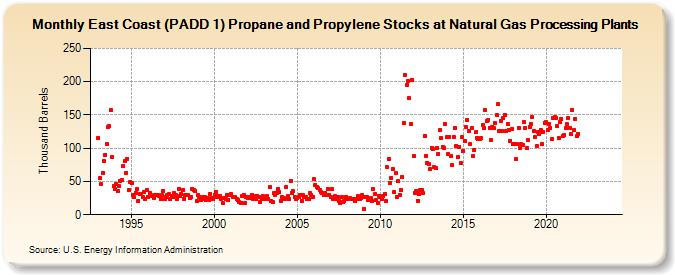
| East Coast (PADD 1) Propane and Propylene Stocks at Natural Gas Processing Plants (Thousand Barrels) | ||||||||
| Year | Jan | Feb | Mar | Apr | May | Jun | Jul | Aug | Sep | Oct | Nov | Dec |
|---|---|---|---|---|---|---|---|---|---|---|---|---|
| 1993 | 116 | 55 | 46 | 63 | 80 | 90 | 107 | 132 | 133 | 157 | 87 | 43 |
| 1994 | 39 | 46 | 35 | 43 | 51 | 52 | 73 | 80 | 63 | 84 | 37 | 49 |
| 1995 | 47 | 29 | 26 | 33 | 38 | 21 | 31 | 31 | 27 | 34 | 23 | 37 |
| 1996 | 27 | 33 | 30 | 28 | 25 | 30 | 29 | 30 | 28 | 23 | 30 | 36 |
| 1997 | 23 | 26 | 30 | 31 | 24 | 28 | 27 | 32 | 29 | 24 | 39 | 28 |
| 1998 | 31 | 37 | 24 | 29 | 30 | 29 | 25 | 27 | 39 | 37 | 36 | 20 |
| 1999 | 30 | 27 | 22 | 24 | 26 | 26 | 22 | 25 | 22 | 31 | 25 | 24 |
| 2000 | 29 | 34 | 27 | 28 | 28 | 23 | 18 | 25 | 24 | 30 | 22 | 30 |
| 2001 | 31 | 26 | 27 | 26 | 24 | 22 | 19 | 18 | 28 | 29 | 17 | 27 |
| 2002 | 25 | 25 | 26 | 30 | 24 | 28 | 23 | 28 | 27 | 19 | 23 | 28 |
| 2003 | 23 | 25 | 28 | 24 | 42 | 20 | 19 | 32 | 29 | 33 | 39 | 34 |
| 2004 | 21 | 27 | 25 | 24 | 42 | 28 | 23 | 51 | 33 | 35 | 27 | 24 |
| 2005 | 25 | 26 | 30 | 21 | 29 | 26 | 27 | 23 | 23 | 32 | 30 | 26 |
| 2006 | 53 | 45 | 42 | 40 | 37 | 34 | 33 | 30 | 32 | 30 | 39 | 30 |
| 2007 | 26 | 38 | 24 | 28 | 23 | 27 | 21 | 18 | 27 | 19 | 21 | 27 |
| 2008 | 23 | 23 | 25 | 24 | 24 | 23 | 20 | 23 | 28 | 23 | 25 | 30 |
| 2009 | 9 | 27 | 27 | 22 | 22 | 25 | 21 | 39 | 31 | 22 | 18 | 28 |
| 2010 | 27 | 23 | 28 | 31 | 20 | 72 | 84 | 48 | 55 | 69 | 34 | 62 |
| 2011 | 26 | 50 | 30 | 37 | 57 | 138 | 210 | 195 | 201 | 175 | 137 | 203 |
| 2012 | 89 | 33 | 35 | 21 | 31 | 37 | 37 | 33 | 119 | 89 | 78 | 76 |
| 2013 | 69 | 101 | 99 | 71 | 70 | 101 | 92 | 127 | 116 | 102 | 101 | 137 |
| 2014 | 117 | 92 | 117 | 89 | 74 | 117 | 131 | 103 | 86 | 102 | 77 | 117 |
| 2015 | 96 | 111 | 132 | 143 | 126 | 106 | 131 | 89 | 98 | 124 | 116 | 114 |
| 2016 | 114 | 115 | 135 | 130 | 157 | 141 | 142 | 131 | 112 | 132 | 130 | 138 |
| 2017 | 150 | 166 | 126 | 141 | 126 | 146 | 150 | 126 | 137 | 128 | 111 | 129 |
| 2018 | 107 | 106 | 84 | 106 | 131 | 101 | 106 | 105 | 140 | 131 | 100 | 112 |
| 2019 | 132 | 137 | 147 | 126 | 117 | 103 | 124 | 122 | 128 | 106 | 124 | 138 |
| 2020 | 139 | 128 | 137 | 130 | 114 | 146 | 147 | 145 | 133 | 116 | 139 | 144 |
| 2021 | 118 | 120 | 130 | 136 | 145 | 131 | 121 | 158 | 127 | 144 | 118 | 122 |
| 2022 | -- | -- | -- | -- | -- | -- | -- | -- | -- | -- | -- | -- |
| 2023 | -- | -- | -- | -- | -- | -- | -- | -- | -- | -- | -- | -- |
| 2024 | -- | |||||||||||
| - = No Data Reported; -- = Not Applicable; NA = Not Available; W = Withheld to avoid disclosure of individual company data. |
| Release Date: 3/29/2024 |
| Next Release Date: 4/30/2024 |