|
Download Data (XLS File) |
|
||||||||
|
||||||||
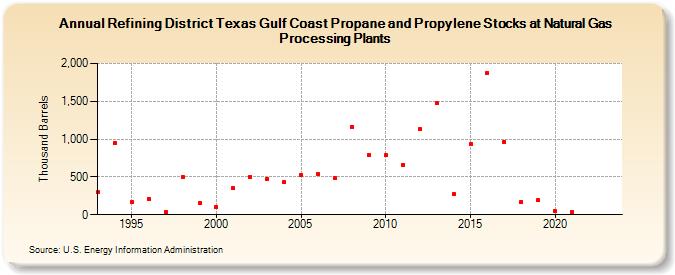
| Refining District Texas Gulf Coast Propane and Propylene Stocks at Natural Gas Processing Plants (Thousand Barrels) | ||||||||
| Decade | Year-0 | Year-1 | Year-2 | Year-3 | Year-4 | Year-5 | Year-6 | Year-7 | Year-8 | Year-9 |
|---|---|---|---|---|---|---|---|---|---|---|
| 1990's | 300 | 950 | 165 | 213 | 36 | 502 | 151 | |||
| 2000's | 102 | 348 | 505 | 477 | 427 | 520 | 541 | 486 | 1,161 | 792 |
| 2010's | 785 | 664 | 1,129 | 1,475 | 271 | 931 | 1,875 | 965 | 166 | 190 |
| 2020's | 43 | 40 | -- | -- |
| - = No Data Reported; -- = Not Applicable; NA = Not Available; W = Withheld to avoid disclosure of individual company data. |
| Release Date: 8/30/2024 |
| Next Release Date: 8/29/2025 |