|
Download Data (XLS File) |
|
||||||||
|
||||||||
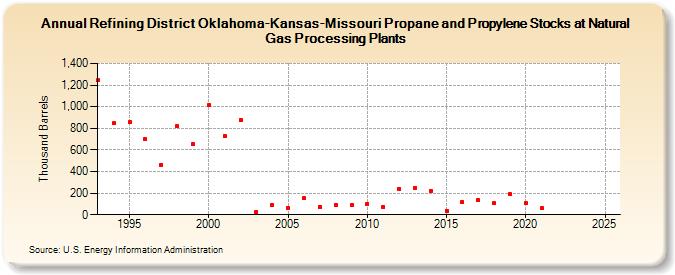
| Refining District Oklahoma-Kansas-Missouri Propane and Propylene Stocks at Natural Gas Processing Plants (Thousand Barrels) | ||||||||
| Decade | Year-0 | Year-1 | Year-2 | Year-3 | Year-4 | Year-5 | Year-6 | Year-7 | Year-8 | Year-9 |
|---|---|---|---|---|---|---|---|---|---|---|
| 1990's | 1,245 | 845 | 858 | 698 | 464 | 817 | 653 | |||
| 2000's | 1,015 | 730 | 879 | 26 | 90 | 64 | 153 | 76 | 90 | 87 |
| 2010's | 99 | 73 | 240 | 248 | 222 | 38 | 116 | 134 | 104 | 189 |
| 2020's | 105 | 61 | -- | -- |
| - = No Data Reported; -- = Not Applicable; NA = Not Available; W = Withheld to avoid disclosure of individual company data. |
| Release Date: 3/29/2024 |
| Next Release Date: 8/30/2024 |