|
Download Data (XLS File) |
|
||||||||
|
||||||||
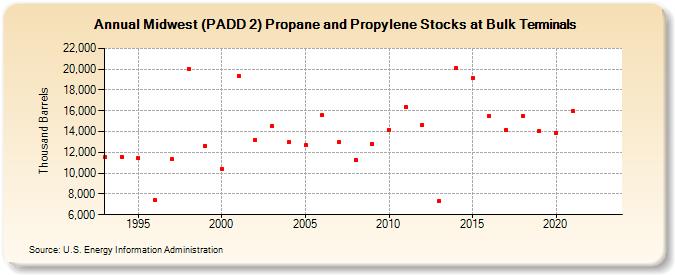
| Midwest (PADD 2) Propane and Propylene Stocks at Bulk Terminals (Thousand Barrels) | ||||||||
| Decade | Year-0 | Year-1 | Year-2 | Year-3 | Year-4 | Year-5 | Year-6 | Year-7 | Year-8 | Year-9 |
|---|---|---|---|---|---|---|---|---|---|---|
| 1990's | 11,525 | 11,588 | 11,451 | 7,411 | 11,318 | 20,049 | 12,618 | |||
| 2000's | 10,416 | 19,361 | 13,194 | 14,523 | 12,986 | 12,671 | 15,578 | 12,955 | 11,280 | 12,835 |
| 2010's | 14,154 | 16,371 | 14,620 | 7,307 | 20,091 | 19,180 | 15,502 | 14,180 | 15,538 | 14,037 |
| 2020's | 13,861 | 15,972 | -- | -- |
| - = No Data Reported; -- = Not Applicable; NA = Not Available; W = Withheld to avoid disclosure of individual company data. |
| Release Date: 3/29/2024 |
| Next Release Date: 8/30/2024 |